
Listed first are particularly notable research results, then the accomplishments of all participants. This information is available for the 2007 and later grants. The most recent grant is listed first, or you may skip down to the same sets of information for the 2011-2015 or 2007-2010 participants.
Last Updated: March 18, 2021
2016-2020 Grant
Listed first are particularly notable research results from REU participants' work. Skip down to accomplishments of all participants in the 2007-2010 grant.
Special Research Nuggets
The items here are especially significant outcomes of REU projects.
Corrections to ASOS Location Errors Improve Validation of Radar-Based QPE
Sebastian Harkema’s work highlighted the need for accurate metadata locations with Automated Surface Observing System (ASOS) precipitation gauges. the differences in location placed over 78% of the gauges in a different 1-km grid box. Placing the gauge observations with the updated latitude and longitude values had a better correlation with radar-based quantitative precipitation estimates (QPEs) and removed instances where non-zero gauges observations were matched with radar QPEs that detected no precipitation. Location errors found in his study were shown to have impacted the validation of radar-based QPE data sets. It is likely that such errors would also impact local bias corrections of radar-based QPE and the quality control of these gauges. His findings will assist NOAA in improving the quality of ground-based observational data.
Highlights of Student Research Accomplishments
Robert Baines worked in the calibration team of phased array antenna towards the development of a fully automated RF scanner to calibrate the polarization characteristics of a dual-polarization phased array weather radar. In this project, Robert was involved in mechanical modeling in Solidworks, control automation using Labview and antennad and electromagnetic theory. This RF scanner is a instrument that will enable the calibrating of dual polarization in phased array radars, which will be the future platform for future radar systems. Robert was focused in the design and fabrication of several mechanical parts using Solidworks and 3D printing technique. Robert helped to test and integrate some features of the RF scanner and very values in this development.
Quiana Berry used a logarithmic regression with historical observations of black-legged tick locations and climate along with downscaled climate model projections to determine if these might change as a result of climate change. Historical observations came from prior literature, while the climate observations and projections were downloaded from the U. of Idaho. Using the data collected, Quiana found that the Gulf Coast of Texas will likely be suitable habitat for black-legged ticks at the end of the century under a changing climate, while Oklahoma will become less suitable habitat, suggesting the possibility for reducing the risk of contracting Lyme Disease and numerous other infectious diseases carried by black-legged ticks. Her result contradict some prior results from other studies in part because she used a different downscaled global climate model from previous studies. This highlights the importance of sources of uncertainty in the climate projections that need to be translated to impact assessments.
Leanne Blind-Doskocil analyzed rain estimates from TOGA radar during the DYNAMO field campaign that took place in 2011 and 2012, discovering an afternoon peak in rainfall that appeared stronger when compared to the climatological diurnal cycle over the tropical ocean. Rainfall amounts increased from the MJO suppressed to enhanced phase due to an increase in stratiform rain. She found a strong afternoon maximum in rainfall during the MJO enhanced phase, which differs from observations by the S-PolKa radar.
Alexandra Borunda performed the first comparison of S- and X-band polarimetric radar observations of tornadic debris, using data collected during the 20 May 2013 Moore, Oklahoma, tornado. It was determined that values of reflectivity at S-band were larger than at X-band, values of differential reflectivity were more negative at S-band, and values of correlation coefficient were lower at S-band. Combining these observations, Alexandra hypothesized that S-band radars are more sensitive to debris, whereas X-band radars are more sensitive to rain. Alexandra is currently continuing her research by comparing the temporal evolution of the tornadic debris signature with the intensity of the tornado and land use characteristics of the tornado's damage path, with the ultimate goal of publishing this work in the future.
Justin Bonds used detailed tornado track information from the May 24, 2011 tornado outbreak and a series of GIS tools to study potential tornado impacts in central Oklahoma. He found that while the risk of a high-impact tornado on a populated metropolitan area was relatively high on that day, it is still rare and unlikely that tornadoes strike those areas and cause large casualty/fatality rates (such as those observed in the May 22, 2011 Joplin, MO tornado and the historic April 27-28, 2011 tornadoes in the Southeastern U.S.). Justin's study also confirmed some of the results from prior REU research carried out by Amber Cannon et al. regarding population exposure and fatality/injury rates.
Erica Bower used an objective technique to classify the start, end, duration, and magnitude of the wet season across the globe. She generated a climatology of wet season characteristics from two observational datasets and identified regional trends over the past 30 years. She then applied this algorithm to fully-coupled climate model simulations of the 20th and 21st century from the Coupled Model Intercomparison Project Phase 5. Results from historical simulations showed model biases, including that models often began and ended the rainy season too early compared to the regularly used Global Precipitation Climatology Project data, but the overall spatial patterns matched those of the observations.
Christian Boyer worked towards the development of a transmitter and signal processing algorithm that would enable a UAV to calibrate the polarization characteristics of a dual-polarization phased array weather radar. Calibrating dual polarization in phased array radars is an important aspect of risk mitigation in moving towards a nationwide multifunctional phased array radar (MPAR) system for weather surveillance and to track aviation. The calibration of scan-dependent polarization in phased arrays is a primary goal in achieving the same products provided by traditional dish-based systems. In Christian’s project, the focus was on the calibration of the radar’s receive patterns, the first step in the overall calibration process. The so-called “Twitching Eye of Horus” circuit on the UAV, which Christian helped test and develop, provides a means for transmission of calibrated horizontal (H) and vertical (V) electric fields towards the radar in a controlled manner from the UAV. Christian worked towards a signal processing algorithm on the radar’s receiver to extract the polarization characteristics of the phased array using these H and V transmission signals from the UAV.
Audrey Brandon used modeling software to develop variants of the classic “Daisy World” model, ones tailored for use in undergraduate explorations. These variants provide explicit examples of simple model modifications as opposed to the more complicated modifications sketched in the literature. Such highly simplified models could be beneficial as aids to understanding the functioning of more realistic Earth-like models. Brandon’s models provide dynamic numerical tools with which to begin explorations of topics such as the impact of clouds of varying properties (e.g., coverage, transparency) on global temperatures, a topic of importance to some geoengineering proposals. Her report expands the literature on the pedagogy of Earth system modeling for undergraduates.
Students Ryan Bunker (meteorology) and David Nowicki (psychology) worked on a collaborative research project in the National Weather Center REU program under Cohen, Hart, Gerard, and Klockow. Bunker and Nowicki investigated nocturnal tornado predictability across the southeast United States, which has direct ties to VORTEX-SE initiatives. Bunker focused on the physical sciences element of this project, using output from the Statistical Severe Convective Risk Assessment Model (SSCRAM) to illustrate the predictability of nocturnal tornado events in the southeastern United States using many different meteorological parameters. He discovered several enlightening results, including distinguishable behaviors of multiple parameters in predicting tornadoes in this regime. Nowicki focused on the social sciences aspect of this project, crafting and deploying a survey of forecasters at several WFOs across the Southeast regarding their interpretation of parameter-based nocturnal tornado predictability via approved surveys. He demonstrated that forecasters tended to over-estimate the conditional probability of severe weather for several parameters, and when exposed to the realistic values, their response was to show less trust in the tool. Issues like this need consideration before deploying this and other probabilistic guidance in the field.
Joseph Burzdak studied the National Highway Traffic Safety Administration’s Fatality Analysis Reporting System and other data to analyze the types of snow events that cause the most fatality-involved traffic accidents each year. He discovered the vast majority of fatalities involve just one or two vehicles and that most fatalities (~75%) occur on primary and secondary roads. Meteorological conditions over two winter seasons showed that a large majority of crashes (~77%) occurred during midlatitude cyclones or lake-effect snowbands, fairly predictable forms of weather. Only 45% of all accidents occur within a watch or advisory polygon, suggesting a more graduated approach for the warning/advisory system in winter storms, as opposed to binary polygons, has potential life-saving benefits.
Morgan Clark identified the model diurnal cycles of CO2 flux and resulting concentration throughout the year. She compared model output to aircraft data and explored the connection between CO2 variations and weather variables from balloon soundings.
Austin Coleman analyzed the forecasts of a dual threat event (i.e. both tornadoes and flash floods) using a rapidly-updating convective scale Warn-on-Forecast ensemble system. The student found that a prototype Warn-on-Forecast system can forecast both threats with good accuracy. She identified that forecasts at 1-km horizontal grid spacing from the downscaled 3-km prototype system introduces many spurious cells with embedded spurious mesocyclones.
Tim Corrie, III evaluated similarities and differences in measurement methods for Wet Bulb Globe Temperature and Heat Index, comparing and contrasting the two measurements. The two methods are often considered equivalent. Tim's work demonstrated that they are different, and not necessarily correlated for exercise-related use and thermal injury prevention.
Soleil Cotterell investigated flow-dependent calibration of one-day forecasts of radar reflectivity in the OU-MAP CAM ensemble on 26 days during the spring of 2019. He used Self-Organizing Maps to identify the dominant spring weather patterns over a 10-year period. Separate forecast calibration during the different flow patterns did not lead to the same skill improvements as a simpler region-dependent calibration, but it was not clear if this was due to the limited sample sizes for some flow patterns or a lack of correspondence between flow patterns that were meteorologically distinct (as quantified by the SOM) vs those with distinct systematic forecast biases. Further skill improvements may still be possible using larger dataset sizes and further optimization of the SOM classification methodology to incorporate measures of model error.
Breecia Crawford worked on extraction of vertical humidity profiles using passive, bi-static weather radar. Breecia showed, using a mathematical model that she programmed in MatLab, that refraction index gradients can be extracted using a a bi- static receiver retrieving scattering data from already established weather radars.
Neil Crosby investigated how the number and location of tornadoes changed, if at all, due to the extratropical transition of tropical cyclones using a multidecadal observed tropical cyclone tornado dataset. Neil showed that extratropically transitioning tropical cyclones produced 30% of all tropical cyclone tornadoes and that tornadoes occurred more often than non-extratropically transitioning cases. His work also found that many of the tropical cyclone tornadoes along the U.S. Atlantic coast were associated with extratropically transitioning cases. Finally, Neil showed no differences in the tropical cyclone-relative location of tornadoes between extratropically transitioning and non-extratropically transitioning cases. Together, these results provided the first study of tornadoes associated with extratropically transitioning tropical cyclones and will serve as the foundation for future work as part of an NSF proposal.
Raquel Dominguez studied the aridity gradient in the Great Plains, first verifying the accuracy of the North American Regional Reanalysis by comparing variable computations from the Oklahoma Mesonet. Contrary to previous findings, Dominguez found that the aridity gradient is diffusing over the Great Plains and that potential evapotranspiration and precipitation share an equal role in the dominance within aridity. Despite high variation of all variables throughout space and time, precipitation shows dominance over aridity index within a monthly climatological record.
Lena Dziechowski created a climatology of U.S. east coast winter storms (ECWS) and analyzed future projections of such storms. Lena used a tracking algorithm developed from prior work based on sea level pressure and near-surface wind speeds. Applying this algorithm to historical data she found that there has been no change in minimum pressure of ECWSs since 1950, but maximum wind speed has increased. This highlights the importance of tracking methods that incorporate more than sea level pressure. An ensemble of climate models accurately represented the historical minimum pressure but underestimated the average and range of maximum wind speeds. In the future, climate models project a decrease in frequency of ECWSs, especially for the northern coast, but no change in intensity. Future simulations also showed fewer early season ECWSs.
Jenelle Edwards studied temperature projections for Oklahoma to determine whether conditions would become more suitable for transmission of Zika and dengue by the mosquito Aedes aegypti. She found that recent meteorological data (1999 to 2018) indicates that there were about 91 to 110 days per year suitable for Zika transmission and 164 to 183 days per year suitable for dengue transmission and that the number of days suitable for Zika and dengue transmission in Oklahoma increased 20 to 35 for dengue and 25 to 40 days for Zika days in several future climate scenarios.
Carley Eschliman compared Oklahomans’ expectations of future climate, collected through the Oklahoma Meso-Scale Integrated Socio-Geographic Network survey, with climate projections. She found that Oklahomans, on average, expect a future that is cooler and wetter than what most projections suggest. Expectations of future temperature were more consistent with low emissions projections, and were significantly significantly related to one’s gender, age, political affiliation, and perceptions about recent temperatures.
Jashawn Ford developed and built a digitally-controlled, ultra-violet exposure unit for post-curing 3D printed parts made by stereolithography. This device greatly reduces the processing time of high-accuracy parts, including electromagnetic antennas and filters, and improves adhesion of metal plating. Jashawn learned how to 3D print antennas and he built a pair of horn antennas to test in his exposure unit. He physically assembled the entire unit, including wiring and soldering. Furthermore, he learned about AC-to-DC rectification and designed a 110VAC-to-12VDC rectifier. The device that Jashawn built will be used for years to come in the Radar Innovations Laboratory.
America Gaviria Pabón tackled the difficult task of classifying a database of flash flood events into impact-based categories. Using an archive of OK/TX flash flood events from 2013-2019, she analyzed the severity of each event and determined whether it was a Base, Considerable, or Catastrophic flash flood. To do this, she parsed National Weather Service warning text, social media posts, news articles, pictures, and videos to get a better understanding of the magnitude of each event. She also tracked keywords associated with the impacts of each event, with the goal of providing NWS forecasters more information about what impacts to expect from each category (e.g. "Considerable flash flood events commonly have vehicles stranded"). Ultimately, she calculated statistics related to impact severity, finding that the majority of flash flood events in the database were "considerable" flash floods. This information is useful to NWS forecasters because it provides a climatological perspective of flash flood severity, as well as common impacts to expect from each category event.
Dana Gillson looked at whether CMIP5 Global Climate Models were able to represent the historical trends, magnitudes, and variability of select extreme metrics over the South Central United States. She used the CLIMDEX suite of metrics to define extremes, including hot and cold temperatures, and heavy precipitation. She separated the region into three climatically-consistent sub-domains, and calculated GCM biases against four different reanalyses for the model historical period. Part of this research identified some large differences in bias depending on which reanalysis dataset was used as 'ground truth'. Dana also identified 5 'best' and 'worst' models, based on their mean bias across all analyzed years, seasons, and reanalyses. Projections with these models indicated possible differences in future magnitudes separated by whether the model captured the historical values well or not, however these results require further investigation to make firm conclusions.
Tyler Green studied the sensitivity of hail generation within storm-scale ensemble forecasts to the horizontal grid spacing of the model for forecast ensembles ranging from 500 m to 100 m in horizontal grid spacing. He found that there were substantial differences in the representation and evolution of hail as the grid spacing was changed. This was despite each ensembles using identical initial conditions and identical physical and microphysical configurations.
As the horizontal resolution of the model became finer, the ensemble was found to predict more localized swaths of larger hail, and more total hail mass. The particle size distribution of hail was found to shift to favor larger hailstones in the higher resolution simulations as well. These differences were found to be statistically significant, and were found not to be tied to the structure of the storm updraft or the near-storm environment, which did not vary significantly as grid spacing was varied.
These results from Tyler's study suggest that the differences seen are due to sensitivity within the microphysical scheme to model resolution; research is ongoing to investigate this possibility. These results will contribute to a future publication currently in preparation, and in the development of future research and operational high-resolution ensemble forecasts capable of predicting hail.
Cara Gregg analyzed where forecasters added value to automated lightning threat objects created from a machine learning algorithm. She found that forecasters increased both the probability of detection and the lead time of the automation, but they often found the task tedious for minor improvements over the automation. Forecasters added value to the automated intelligence (AI) by adding discussion to the objects; by modifying the size, severity, duration; and increasing the probability of the lightning associated with the storms. Reviewing comments from the forecasters and comparing it to where the forecasters made the highest number of changes from the automation, she suggested that the automated intelligence could be improved by focusing on where the forecasters commonly made the same changes (for example, increasing the size of the automated objects by default) and allowing forecasters to continue to add value through the discussion to storms possibly posing higher impact.
E’lysha Guerrero utilized high temporal resolution surface observation data from the Oklahoma Mesonet to analyze temperature inversions created from the passing of a total solar eclipse. The focus of her work was on the August 2017 eclipse, which occurred during the peak of near-surface temperature inversion development. While heavy cloud cover can have similar impacts on these inversions due to reduced surface solar radiation, they also typically coincide with other factors (such as wind and rainfall) which can also have impacts. Her work helped better understand how the reduction of solar radiation alone modifies the intensity of these inversions, which are important factors in air pollution monitoring, agricultural treatment applications, and severe weather forecasting.
Uriel Gutierrez’s main research goal was to further develop a hypothesis on the drivers of rapid sea ice loss. He found that oscillations in change of sea ice extent (1979-2014) at synoptic time scales were shown to be statistically significant with respect to red noise. Synoptic time scale reductions in sea ice extent occur most frequently in July and in December. Composite of top 1% of abrupt loss in sea ice extent events revealed strong winds over loss area. These conditions always occurred with a nearby surface cyclone; enhancement from anticyclones could sometimes also occur.
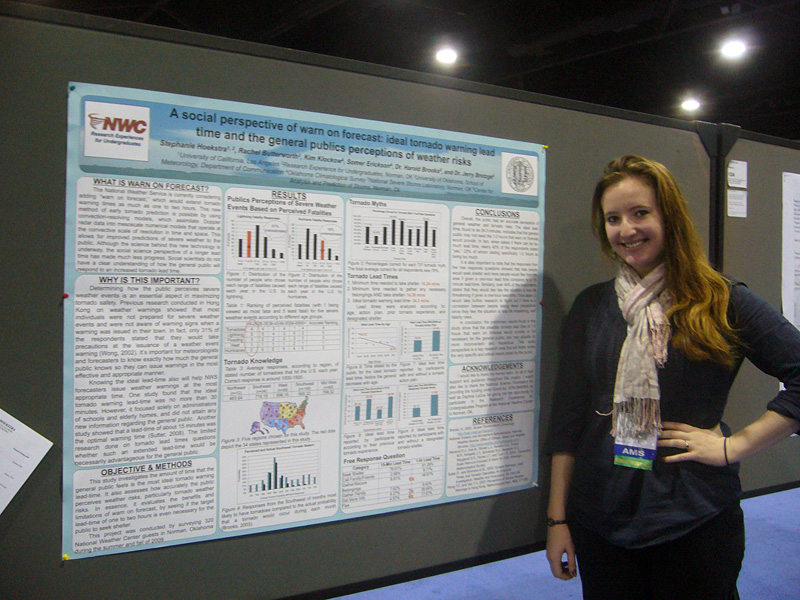
Sebastian Harkema found that the latitude and longitude metadata of the Automated Surface Observing System (ASOS) gauges were not accurate, and the differences in location placed over 78% of the gauges in a different 1-km grid box. Placing the gauge observations with the updated latitude and longitude values had a better correlation with radar-based quantitative precipitation estimates (QPEs) and removed instances where non-zero gauges observations were matched with radar QPEs that detected no precipitation.
Hope Judkins studied satellite-derived landcover changes in the past 25 years along the China-Central Asia-West-Asia Economic Corridor, particularly the region around Almaty, Kazakhstan. She identified factors including population growth/decay, changes in cropland, socio-economic impacts, and urban morphology that made the area susceptible to emerging health vulnerabilities. Urbanization appears to have the largest influence on the risk of emerging infectious diseases.
Ronald Kennedy, Jr. Tornado verification by NWS region showed that central region was the main contributor to the POD reduction at the national scale.
Francesca Lappin examined the impact of two changes made to the 2017 configuration of the NSSL Experimental Warn-on-Forecast (WoF) System for ensembles (NEWS-e) from the previous year: 1) use of the NSSL two-moment microphysics scheme (replacing the partial two-moment Thompson scheme and 2) the addition of METAR surface data to the assimilated dataset. She analyzed the results from three severe weather days during spring 2017 and found that the change to the NSSL two-moment scheme positively impacted surface precipitation forecasts by eliminating spurious areas of lighter precipitation produced by the Thompson scheme. As for the second change, the inclusion of additional METAR data, Francesca discovered that it increased the probability of detection (POD) of rotating objects (i.e. supercell thunderstorms) in the NEWS-e and improved the track of the simulated tornado-producing Elk City, OK supercell. These findings were important for the continued development of the NEWS-e as a WoF prototype system.
Michael Lavallee utilized the dense spatial rain gauge network from the Oklahoma Mesonet and the Arkansas-Red Basin River Forecast Center’s P3 radar precipitation estimator to understand precipitation estimate errors resulting from radar location distance. As radar beams travel farther from their source, they sample higher in the atmosphere where characteristics of both stratiform and convective precipitating clouds differ. Thus, the understanding of over and underestimations of rainfall as a function of distance from the radar source can allow adjustments to be made to the precipitation calculations for more accurate estimations. These improvements in the radar-derived precipitation estimations will have positive impacts on flood forecasting, hydrological modeling, and agricultural advisement.
Theresa Lincheck analyzed vertical profile data collected by the OU CopterSonde UAS during the 2018 ISOBAR field campaign in Northern Finland to quantify the depth of the stable boundary layer (SBL). Two metrics were analyzed: 1) the height of the maximum potential temperature gradient and 2) the height of the maximum horizontal wind speed. Theresa found that the maximum wind speed heights revealed they consistently formed around 80 – 100 m above the maximum temperature gradient heights, indicating that a combination of the two metrics may be of most value operationally.
Briana Lynch did some exploratory data analysis using different trace gases in Paris. She learned that some gases are correlated with CO2 and others are anti-correlated, and that this shows up in the measurements we analyzed. She verified the anti-correlation between the planetary boundary layer depth and the daily time series of trace gas measurements.
Russell Manser successfully completed multiple simulations with WRF-Chem and analyzed both meteorology and chemistry of each run. He found that WRF-Chem can reasonably reproduce the physical characteristics of observed convection, but shows some questionable results with respect to the transport of trace gases. His research produced more meaningful questions rather than answers, but the process was fruitful for both of us.
Kristina Mazur met with Tribal Emergency Managers (EMs) from three Nations in Oklahoma (Citizen Potawatomi, Chickasaw, and Choctaw) to identify weather and climate-related hazards of particular concern. These meetings established the research focus on extreme precipitation. Kristina analyzed data from 15 downscaled global climate models, and two emissions scenarios, to project changes in heavy precipitation at various thresholds. Her results indicated that the frequency of very heavy precipitation is anticipated to increase in all three Nations. This information was presented to the Tribal EMs, and the research may be expanded in the future to assist Tribal adaptation plans.
Olivia McCauley analyzed radar signatures of 18 tornadic and 5 non-tornadic quasi-linear convective system (QLCS) mesovortices. QLCS tornadoes pose a significant forecast challenge because they often form between radar scans. McCauley’s analysis showed that the most beneficial radar precursor signatures may be ZDR columns, enhanced areas of KDP around developing mesovortices, as well as concentrated areas of enhanced spectrum width at the low levels.
Ivy MacDaniel became quickly involved with taking observations from a mobile instrument platform here at NSSL and identified problems with a particular observation which were previously unknown. She was able to somewhat quantify this error, and was eventually able to write up a short paper describing her findings.
Sarah McCorkle did initial tests on a new calibration method for the HREF v2 hail algorithm machine learning results from the Spring Forecast Experiment of 2018. This involved finding a usable source of storm reports, working with large meteorological datasets, and programming in Python. Her results indicated that the calibration worked well, and it has subsequently been incorporated into the 2019 Spring Forecast Experiment.
Karen Montes Berríos’s biggest accomplishment may have been how much she learned about meteorology, but she also gave us some sense of what an impact of a violent tornado might be in Norman, OK. It was a cursory look at the potential impact of such a storm. Her research sets the stage for further development by another student during the subsequent school year.
Joseph Nardi performed verification of machine-learning-based hail forecasts produced during the 2016 Hazardous Weather Testbed Spring Forecast Experiment. During his work, he found that the machine-learning-based forecasts performed as skillfully or more skillfully than other forecast methods in use, including the Thompson hail method and the HAILCAST algorithm. These results will be valuable in the continued development of machine learning tools for hail prediction.
Carly Narotsky investigated trends in the position and strength of the Northern Hemisphere stratospheric polar vortex over the last century and projected changes to the vortex under future climate change. As the polar vortex has dynamical links to tropospheric winter weather regimes across the middle and high latitudes of the Northern Hemisphere, understanding its trends may provide insight into the nature of future winters. Carly employed several metrics of polar vortex strength and location along with some statistical techniques in both reanalysis and coupled climate model output to investigate the trends. There was a large volume of data to process, and Carly did a lot of work to synthesize these data. The reanalysis results indicated that the stratospheric polar vortex strength is characterized by periods of high variance in the past, with decadal periods of strong and weak regimes detected. This ultimately means that the vortex possesses significant internal variability that complicates hypothesized links between climate change and the recently-observed weakening trend in the vortex. The coupled climate models do not reproduce the observed 20th century polar vortex trends and also have diverging trends for the future. Ultimately, more analysis is needed, including linking the trends to dynamical quantities like wave fluxes and other stratosphere-troposphere coupling diagnostics. However, Carly's work established some benchmarks for understanding the recent observed trends in the polar vortex.
Stormi Noll used mPING reports within the composite of all 19 days in 2017, and found that 1 out of every 5 storms associated with an mPING report contains non-severe hail. This means it would not be noted in any logged report, such as Storm Data. Thus, assuming this sample is representative, about 20 percent of convective storms will generate small hail at the surface. This poses significant issues for QPE algorithms, especially legacy algorithms that depend heavily on radar reflectivity. This proportion of storms that produce hail that reaches the surface is significant and warrants further efforts to both record non-severe hail occurrence rate to better understand and mitigate effects on QPE. One possible method to further study hail and its associated radar properties is to develop a way to automatically pair mPING reports with the related radar, satellite, and other relevant data sources. Ms. Noll found that by pairing these data we can improve or adjust current hydrometeor classification algorithms to better account for the presence of hail. An overall limitation of these data are that hail occurrence within thunderstorms is ephemeral: a thunderstorm may produce only one brief period of hail, or may produce an extended period of hail fall, possibly over several periods. Thus, these data are likely to represent a lower bound on the proportion of thunderstorms that generate hail reaching the surface.
Marco Paredes re-examined the role of tropical cyclone outer size on tornado production because previous studies had used subjective size metrics. Using a less-subjective, more reliable outer size metric from a modern outer size dataset, Paredes conducted a statistical analysis to determine that tropical cyclone outer size is not a strong factor in determining either the number of tornadoes or their distance from the tropical cyclone center. While outer size may not provide a direct influence on tornado behavior, a more extensive look at convective evolution in tropical cyclones would greatly benefit the field in future work.
Jamin Rader studied data from two years of field comparison data in Oklahoma of three anemometers (two with anti-icing properties) to determine the usefulness of two forms of anti-icing technologies. One anemometer was designed to have anti-icing construction, one was coated with an over-the-counter super-hygrophobic spray, and the third was a standard anemometer. Mr. Rader analyzed both the time delays in when each anemometer was coated in ice (e.g., wind speeds to zero) and when the anemometers returned to normal operations upon the melting of the ice. He found no real discernible difference in how they handled icing events. Two of the tested anemometers claimed anti-icing properties that, in reality, that turned out not to be completely true (e.g., advertising vs. reality). The results of this work helped the Oklahoma Mesonet determine if either of these two anti-icing approaches would be of use to monitoring wind speeds and directions in a region prone to ice accumulations in the winter.
Jordan Robinson examined the similarities and differences in how radiosondes and UAS represent temperature inversion layers within the Arctic stable boundary layer. He did so by utilizing an objective algorithm to quantify the strength and depth of temperature inversion layers observed by radiosondes in Northern Alaska and the OU CopterSonde UAS in Northern Finland. He found that in general, temperature profiles close to the surface in Finland were more stable than in Alaska, but these differences may likely be due to the higher sensitivity of the UAS as an observational platform.
Zuleydian Roche Rivera performed an initial analysis of a uniqe data set collected at an Oklahoma Mesonet site: a one year time-series of photovoltaic (PV) solar energy production, solar insolation from a pyranometer oriented with the solar panel, and temperature of the solar panel. This is the first step toward using these data to more accurately assess the potential for solar energy production in the state using standard Oklahoma Mesonet data sets. The relationship between the insolation and the power production was examined and fit well to a cubic function in each of four seasons. A dependence of PV production on temperature was expected but not found after applying the seasonal power curves.
Henry Santer analyzed the accuracy of new dual-polarization radar-based precipitation estimates from the Multi-Radar Multi-Sensor (MRMS) system. The analysis period was 18 months over the entire contiguous United States, with over 8 million rain gauge-radar matched samples of hourly rainfall accumulations included in the dataset. The primary objective of the study was to compare the new dual-pol precipitation to the previous non-dual-pol methods used by MRMS to quantify whether the new techniques have improved skill and/or reduced uncertainty. The two major findings of Henry's work were that: a) the new dual-pol rain estimation techniques indeed exhibited improved bias and overall accuracy over previous estimates where it could be applied near radar locations, but b) the analysis also suggests that the use of an evaporation correction in the dual-pol method can worsen underestimates in areas far from radars, especially in the western United States.
Melanie Schroers analyzed future projections of heat waves and cooling degree days for six large cities across the south-central United States. She used an ensemble of cutting edge statistically downscaled global climate model simulations to assess the change in extreme heat events in the late 21st century compared to the historical period. Heat waves were found to more than triple for each city and cooling degree days were found to increase from 50 to 85% by late century. This research will be important for helping cities prepare for possible future impacts caused by an increase in extreme heat events.
Elizabeth Sims contributed to an important piece of a larger project: to see if we can derive precipitation intensities that map to ASOS intensities for an operational product in the MRMS system. She investigated the ability to use categorical precipitation intensity from the Automated Surface Observing System (ASOS) and intensities from the Multi-Radar/Multi- Sensor (MRMS) system (base reflectivity, composite reflectivity, and liquid precipitation rate). She compared cold season intensity measurements during rain and snow from these two sources to determine the feasibility of providing intensity as an additional component of the surface hydrometeor classification scheme currently being developed at CIMMS/NSSL. Her work showed that ASOS snow intensity is not an effective discriminator of MRMS intensity measurements, and that the usefulness of ASOS rain intensity was unclear.
Hope Skypek analyzed a 180-year climatology of severe weather environments from the 20th-century reanalysis version 3 (20CRv3) for the period 1836-2015. She investigated the spatiotemporal trends in frequency and magnitude of environmental parameters known to be favorable for severe thunderstorm formation, such as convective available potential energy, deep-layer vertical wind shear, and their covariation. Hope found an increasing trend in the number of days favorable for severe weather, especially within the first ~50 years of the data period, which appear largely driven by increases in the magnitude of vertical wind shear. These trends also revealed themselves spatially, with increasing frequency of conditions favorable for severe storms in the eastern U.S. and decreasing frequency in the northern Great Plains. Additionally, she found that the annual cycle was impacted, illustrating that the severe weather season has lengthened considerably through time. Some of these trends may not be physical, however, and these important early results will help guide future research that aims to identify periods within the dataset that are reliable for the study of severe weather and climate.
Michael Smith used EF1 and greater tornado reports from 1954-2015 to compute three methods of determining rarity: maximum rarity factor (single day/climatology), area (rarity >=100), and intensity (tornadoes >=F3/EF3). The resulting 442 day dataset had about 7 days each year. He found that intensity occurs earlier in the year than area, and both occurred earlier than maximum rarity. Among the top 10 rankings of each factor, 4 dates are shared between intensity and area; no dates from maximum rarity appear on the other two lists. Interestingly, while the April 2011 outbreak placed only in the top 50 in area, that month had seven consecutive days meeting a rarity criteria.
Michelle Spencer studied 6 2015 Plains Elevated Convection At Night field campaign events to investigate possible connections between a heterogeneous jet and nocturnal convection initiation. Cases showed clear diagonal striation signatures, suggesting the NLLJ is heterogeneous in structure and the heterogeneity is much more common than previously thought. This signified a change in the structure of the NLLJ and a missing component to past LLJ climatologies. One case, studied in detail, showed evidence that the NLLJ may be acting as a forcing mechanism for nocturnal convection initiation in the absence of other forcing mechanisms. The NLLJ and its heterogeneous spatial-temporal evolution should be taken into consideration when forecasting for nocturnal convection initiation, especially in the absence of more traditional trigger mechanisms.
Aodhan Sweeney helped refine and apply a storm tracking algorithm to over 10 years of 5-min CONUS-wide radar volumes. His research provides one of the first storm-based climatological studies and aims to primarily identify the birth and cessation points, duration and speed, and seasonality of storms. This work helps to pave the way for future storm-based analyses and provide new objective insights into the observed behavior of convection.
Cha’Lita Thompson the production of ozone in the planetary boundary layer during the day and how it is affected by the nocturnal low-level jet at night. She studied the feasibility of using unmanned aircraft systems to build a vertical profile of the planetary boundary layer because they are customizable and versatile, giving flexibility to researchers and allowing them measure ozone concentrations as well as other atmospheric parameters such as trace gases, temperature, humidity, and aerosols. These systems would enable measurements during non-peak hours, for example, midday and late evening. Her project set forth guidelines and effective procedures for integrating trace gas measurements into UAS.
Emily Tinney's project was designed for her to learn how to program, construct a scientific question and explore data to address the question. These goals were accomplished through her project to discover if we could relate the low level jet to severe storm evolution. We quickly learned that using a standard low level jet classification was not readily applicable to the storm environments we were exploring, thus we found ways where our theory was met with application challenges. As Emily pivoted to understand how to make a more suitable classification she developed new testable hypotheses for relating the low level wind field to severe storms, but alas this came at the end of the 10 weeks. Emily learned how program, reconcile theory with application, and fight through the scientific process and develop new hypotheses that could begin to answer the "harder than we thought" scientific questions.
Robert Van Kleeck analyzed heat burst recorded by the Oklahoma Mesonet from 1997 to 2016 to determine whether heat bursts could be detected automatically. Previous studies of heat bursts detected by the Oklahoma Mesonet utilized dry-bulb temperature, dew point temperature, and wind gusts, while Mr. Van Kleeck additionally utilized dew point depressions and dew point depression ratios. This work showed a more accurate detection methodology without allowing non-heat burst event, such as dry line passages, from being falsely detected. Mr. Van Kleeck's work will be utilized by the Oklahoma Mesonet to potential override false positive quality assurance algorithms, which would mark observations during heat bursts as invalid measurements.
Jacqueline Waters conducted a survey of all CONUS airports to assess the amount/quality of radar coverage in their terminal air spaces (TASs). A range of coverage is noted, although no TASs are completely covered, some have as much as 87% coverage. For those airports with a WSR-88D on property, the quality of coverage is very good. However, when the radars are in VCP 31 (a common mode during icing events), it is difficult to detect some microphysical processes aloft. Those airports that are 150 km or more away from their nearest radar, have less than 50% of their TASs covered and overshooting is a significant problem. Even when relevant layers of phase transition are in the scope of the radar, for these airports, beam broadening so strongly degrades the returns that these important transition zones cannot be discerned.
Hayden Webb examined cloud-to-ground (CG) lightning flashes that occurred in the vicinity of communication towers to determine the characteristics of these flashes including their initiation location, propagation, and size of the flash. Data from the National Lightning Detection Network (NLDN) was compared with VHF data from the Oklahoma Lightning Mapping Array (LMA) and radar data from the Weather Service Radar - 1988 Doppler (WSR-88D) network to determine: (1) the initiation location and height, (2) the size (temporally and spatially) of the lightning flash, (3) any seasonal dependence, and (4) the associated storm structure and storm type. Of the 45 CG flashes occurring with 1 km of 10 communication towers in Oklahoma included in the study, 60% flashes interacted directly with the tower, 20% were re-classified as in-cloud flashes, and 20% of flashes were classified as upward lightning, mainly triggered by a nearby preceding CG. CG flashes, beginning in-cloud and terminating at the tower, were the dominant flash type across all seasons, independent of the convective mode and the storm structure.
Melanie Zambron analyzed data from 2020 tornado events across the Southeast United States to understand relationships between radar signatures, damage surveys, and complex terrain. Past studies have hypothesized that tornado and supercell evolution are affected by complex terrain, including both the occurrence of tornadoes and their ensuing intensity. Her analysis found that radar-sampled mesocyclone-scale winds were more correlated with terrain than tornado-scale winds.
Previous Grant, 2011-2015
Special Research Nuggets
The items here are especially significant outcomes of REU projects.
2015 Participants:
Discovery of Polarity Misclassification in ENTLN Data
The results of the James Coy, Jr.’s study were shared with both Vaisala and Earth Networks. Partly in response to James’s discovery of the polarity misclassification within the ENTLN data, Earth Networks modified their algorithm identifying the polarity of CG flashes. James completed a reanalysis on his own time in the fall semester of the reprocessed data and confirmed the algorithm updates now produced accurate polarity and location estimates of CG lightning.Insensitivity of Supercell Forecasts to Initial Conditions
Elisa Murillo found a relative insensitivity of supercell forecasts to initial condition, which indicates that smaller-scale processes within organized convection are primarily governed by larger scales, and that real-time supercell forecasts over the next decade will not be strongly degraded by our limited ability to analyze very fine intra-storm scales. This motivates development of data assimilation & prediction systems that prioritize forecast over analysis grid resolution, and suggests that improvements to model physics/numerics and observations of storm environment will increase forecast skill more than will increasing the density of intra-storm observations.
2011 Participants:
Rapid Identification of Severe Surface-Level Winds
REU student Adam Taylor quantified the impact of having low-level, dual-Doppler radar data available for detection of severe surface winds. Mr. Taylor found that operational forecasters would be able to identify areas of severe winds much faster, and with much greater accuracy, if overlapping low-level radar coverage (e.g., CASA data) was widespread. Furthermore, Adam found that even a simple tool that corrected radar-derived wind speeds for height above ground (applying a wind profile correction) could aid forecasters in estimating surface wind speeds.Anticipating Tornado Casualties for Emergency Planning
Amber Cannon used a GIS analysis to compare rates of incidence of fatality, by population density, for the Alabama portion of the 27 April 2011 and 3–4 April 1974 tornado outbreaks. If replicated and done over many geographic areas, this research could be combined with the distribution (number, intensity, size) of tornadoes expected with convective outlooks to help FEMA anticipate rates of incidence of fatality/injury hours to days ahead of time, enabling them to leverage resources for immediate response.Assimilation of AQUA Data Improves Track Forecast of Hurricane Danielle
Although results are preliminary, Travis Elless's research highlighted the importance of studying the impact of the data and data assimilation methods on tropical cyclone forecasts. His work will be continued in Dr. Xuguang Wang's research group.Simplifying Microphysics Parameterization to Achieve Better Forecasts of Convection
Diversity in the physical parameterizations used in forecast ensembles is already known to provide robust variance amongst the ensemble members in mesoscale forecasts (resolution of 10 to 30 km). Sam Lillo’s research made a first systematic look at some possible means to achieve physics diversity within a single advanced microphysics parameterization for convection-resolving forecasts (resolution ~1km). The work has implications for the Warn-on-Forecast initiative, which aims to assimilate radar data to provide short-term forecasts of severe weather. The density of radar data can drastically reduce ensemble spread, and this research considered sensitivities that affected warm-rain physics, precipitation efficiency, and large ice hydrometeor characteristics that may help maintain storm-scale ensemble efficiency.Rapid-Scan Dual-Polarimetric Radar
Alex Lyakhov used the RaXpol, a state-of-the-art dual-polarimetric mobile radar to scan a supercell and weak tornado. His research documented rapid changes in tornado and mesocyclone evolution during tornadogenesis and tornado dissipation and their relationship to polarimetric supercell signatures.
Highlights of Student Research Accomplishments
2015 Participants:
Proper designation of the rain/snow line in complex terrain is of pivotal importance for water resource management. Current operational methods, however, only use very simple temperature thresholds to delineate this zone. REU student Massey Bartolini explored the option of designating a rain/snow transition zone where both forms of precipitation exist using a spectral bin microphysical model that he specifically tuned to output the liquid water fraction of falling hydrometeors. His work shows the underscores the complexity of the problem and that simple "rules of thumb" are not likely to work in most situations. He was also able to demonstrate that one can effectively deduce the rain/snow transition zone using his model.
Tomer Burg assessed the skill of updating precipitation diagnostics for Rapid Refresh (RAP) with crowd-sourced mPing reports of precipitation type. He found that his statistical analysis improved the bias slightly for ice pellets, snow, and freezing rain, while bias degraded for rain. The upgrade to the RAP generated more realistic spatial distributions of precipitation type transition zones which were statistically significant, though they may not be practically significant.
Matthew Campbell studied damaging wind producing quasi-linear convection. He studied Mesoscale Convective System (MCS) evolution to categorize the systems and code them for quantitative analysis of data. He found that MCS organization and structure can be related to MCS motion, with the best organized MCSs consisting of a well-defined mesoscale convective vortex and transition zone where the fastest motion and propagation led to a convective line oriented relatively perpendicular to the mean wind. The relationship between MCS structure and motion could be used, in addition to damaging wind reports, to classify MCSs. Matthew’s REU work is being submitted for publication in Weather and Forecasting. Many of his findings relating various degrees of MCS structure to degree of propagation and decomposition of the propagation vector are enlightening in terms of the role these structural entities in various MCS types play in influencing system longevity and motion.
James Coy, Jr.’s compared detection of cloud-to-ground (CG) lightning flashes as measured by both the National Lightning Detection Network and Earth Networks Total Lightning Network with three-dimensional lightning mapping observations from the Oklahoma Lightning Mapping Array and storm chaser video recorded of the 31 May 2013 El Reno tornadic supercell. Initial results from the NLDN and ENLTN indicated a negative CG dominance, but, after a 15 kA peak current filter was applied, the NLDN indicated primarily positive CG polarity flashes while ENTLN still indicated primarily negative CG polarity. The average distance between the two networks for the same flash was more than 2 km and improved to approximately 1 km after the 15 kA filter was applied.
Rashida Francis examined two of six cases that forecasters had worked during the experiment. Forecasters were assigned randomly whether they received radar data only, radar plus total lightning, or radar, total lightning, and Earth Network’s Lightning Alerts. She found in one of the two cases that having lightning data increased forecasters’ confidence for good warning decisions, but for the second case, the electrically active storms were not severe. The presence of lightning data appeared to make forecasters more likely to warn, leading to false alarms. Lightning data had a mixed influence on their confidence during the second case, because the lightning data remained active but storm reports were not received.
Amber Liggett analyzed a number of gust front cases to confirm their polarimetric radar signatures, and the cause of these signatures (i.e., from insects). She successfully executed the neuro-fuzzy gust front detection on these cases and performed evaluation of the algorithm.
Elisa Murillo studied the sensitivity of supercell simulations to the resolution of initial conditions in a convective allowing ensemble modeling system. She found that vorticity was the variable most sensitive, while other variables (updraft strength, surface winds, and rainfall) showed little sensitivity to the initial condition resolution after the first 10-20 minutes. Scales missing from supercell initial conditions are rapidly generated as the forecast proceeds, and in most ways do not unduly degrade the forecast. See also Significant Results section of this report.
Natalie Ruiz-Castillo’s study was a projection in future changes in growing degree days of winter wheat; southwest Oklahoma is one of the most productive regions that is growing this highly consumed crop. She used new statistically downscaled outputs and focused on the subset of the Red River Basin. Her results show that at the end of the 2098 growing season, the increase in growing degree days (GDD) is expected to be between -2.0 and 6. Also, depending on the global climate model (GCM) used, Southwest Oklahoma is expected to see an increase in future GDD under the CCSM4 GCM, and a mix of increase, no change and decrease under the MIROC5 GCM.
Ryann Wakefield explored in more detail the possible link between soil moisture and convection, extending that work to explore whether there was a link to tornado activity on either regional or local scales. She found varying relationships between 6-month antecedent soil moisture averages in the five regions east of the Rocky Mountains that she studied, and that correlations were different for different times of year. This provides motivation to further study the physical mechanisms causing such relationships. Further, she compared the Climate Prediction Center’s (CPC) modeled soil moisture to values from the Oklahoma Mesonet to demonstrate that the CPC dataset reflected reality well. Ryann presented her work at the 22nd Conference on Applied Climatology at the 2016 Annual Meeting of the American Meteorological Society, where she won a student presentation award.
2014 Participants:
Nadajalah Bennett conducted a door-to-door survey of homeowners throughout the cities of Moore and Oklahoma City during the month of June 2013 to learn whether and how homeowners had incorporated mitigation techniques into their rebuilding and emergency preparedness decisions. She found that most homeowners had either considered or were considering installing a storm shelter inside their home to help them feel safer. Cost was the main reason for not implementing mitigation strategies. Many homeowners were unaware of other techniques they could use to prevent tornado and wind damage.
Robert Conrick studied effects of changing the boundary- and surface-layer parameterization scheme on forecasts of a lake-effect snow. The forecasts were quite sensitive to the choice of scheme, with differences in the six-hour liquid- equivalent accumulated precipitation on the order of 20 mm. The root cause of these differences is the manner in which the heat and moisture fluxes off of the lake are computed in the different surface-layer schemes. When the schemes are modified to use the same set of equations, the resulting forecasts are in very close agreement.
Rebecca DiLuzio calculated and compared verification statistics for Earth Networks’ Dangerous Thunderstorm Alerts (DTA’s) including probability of detection, false alarm ratio, and lead times of the DTAs compared to the National Weather Service’s severe and tornado warnings.
The goal of Kwanshae Flenory’s project was to examine the ocean and climate drivers related to extreme summer heat in SE Australia. She related January temperature data for selected sites in SE Australia to drivers, such as atmospheric blocking, teleconnections, concurrent and lagged sea-surface temperatures (SSTs). Optimization of the relationships by artificial intelligence techniques revealed a nearly equal contribution from nearby ocean SSTs and the atmosphere with close to a 50 percent predictability on independent data, substantially more accurate than with methods that had been used previously.
Montgomery Flora analyzed differences between idealized supercell simulations using different horizontal grid spacings. The analyses focused on model output most relevant to convective hazard forecasting, including low-level vorticity, surface winds, and rainfall. The results of the work will help guide the design of convective-scale ensemble forecasting systems, including the real-time systems envisioned by the Warn-on-Forecast paradigm.
Shawn Handler created a map that would allow forecasters to determine how likely it was that a tornado at their location would be accompanied by a debris signature. While the tornado debris signature has received a lot of attention, it is simply the case that the height of the radar beam, the strength of the tornado and the type of ground cover preclude tornadoes being accompanied by a debris signature in most locations in the United States. This research will help weather forecasters’ expectations for where they can expect to see such signatures.
Joshua Gebauer studied the feasibility of using atmospheric soundings as an indication of when Bragg scatter by comparing ~11,500 radar/sounding pairs obtained from 66 WSR-88Ds spread over the climatic regions defined by the National Climatic Data Center (Contiguous United States) for the six month period January to June 2014. Of 464 radar cases identified by the algorithm as having Bragg scatter, ~85 percent were corroborated by sounding data. Conversely, sounding data indicated the potential for Bragg scatter far more often than was actually observed but a majority of the times a radar was operating in a mode for which the Bragg scatter algorithm could not be applied. Regionally, Bragg scatter identified by radar was confirmed more often by refractivity gradient for the eastern through south central US and western climatic zones. However, gradient Richardson number more often confirmed Bragg scatter in the mountainous west and north central U.S.
Nathan Kelly studied data from the Oklahoma Atmospheric Surface-layer Instrumentation System (OASIS) project, which involved placing instrumentation focused on observing the surface energy budget at 89 Oklahoma Mesonet stations beginning in 1999. At any given time, 10 stations (designated “super sites”), were outfitted with additional instrumentation including a four component net radiometer with the capability to observe incoming and outgoing shortwave (solar) and longwave radiation. Data are available from the beginning of 2000 until October 2008. This data was filtered to remove observations non-representative of the days albedo (e.g. sunrise and sunset periods, cloudy days, and erroneous instrument readings) and monthly averages were computed for each of the super sites in order to develop a better understanding of the spatial and temporal variability of albedo in Oklahoma.
Thong Phan studied the use of polarimetric radar data to identify radar echoes that were due to electronic interference. His findings are a start to this project; the project will aid in the current quality control algorithm to be more efficient for operational use.
Julia Ross analyzed portions of a survey of shelter-seeking actions taken by Oklahomans during the three tornadic events that took place in May of 2013 in central Oklahoma. She focused her efforts on summary and conditional statistics that revealed that more people took actions on the third event than the subsequent two. Of those who indicated they drove somewhere during one or more events, they did so because they felt the buildings they were in were unsafe; and that the storms on the third seemed more dangerous.
Lori Wachowicz analyzed data her mentors had generated from a month-long Antarctic reanalysis using an ensemble Kalman filter (EnKF) data assimilation method with the Antarctic Mesoscale Prediction System (AMPS) model. AMPS is the only operational model in the Antarctic and is maintained by the National Center for Atmospheric Research (NCAR). The uncertainty in atmospheric state estimates is high over the Antarctic because there are relatively few observations to constrain numerical models. Lori's analysis revealed that our EnKF method creates a reasonable and comparable atmospheric state estimate as AMPS alone, but by using far fewer observations by utilizing information about the background atmospheric flow as a function of time. Furthermore, she found that our model overestimates stratospheric ozone concentrations, leading to a large bias after polar sunrise when the ozone hole develops.
Grant Williams used a modified genetic algorithm to determine how to place wind turbines for wind energy in such a way that the choppy, turbulent wake from one turbine has a minimal effect on nearby turbines. The algorithm he built was able to use the computation power of parallel processing and multiple processors to produce results much faster than running the algorithm sequentially on a single processor.
2013 Participants:
Deanna Apps used quality-controlled data from the citizen science smartphone app called mPING to examine how well the RAP, NAM, and GFS weather prediction models forecasted rare versus more common precipitation types. For two events in February 2013, in which snow, freezing rain, ice pellets, and rain all occurred, she found that the three numerical prediction models forecasted rain and snow significantly better than freezing rain or ice pellets.
Samantha Berkseth looked at how dual polarization variables can be used to improve quality control algorithms that filter non-meteorological targets. Her work contributed to a journal paper (currently under review) and has helped improve the quality control of radar reflectivity data, something that underpins most automated uses of radar data such as precipitation estimation and hail diagnosis.
Levi Cowen looked at winter precipitation and 500 hPa geopotential height to predict spring tornado activity in Oklahoma. Although his findings determined there was no significant correlation between Oklahoma tornado activity following wet versus dry weather, Levi found that persistent midlevel troughing over the northwestern U.S. and southwestern Canada in the wintertime enhanced tornadoes in Oklahoma in the following spring while ridging suppressed them. Levi's findings have and will be shared with the WFO Norman staff to better prepare for springtime tornado season in Oklahoma. Levi has been encouraged to formally publish his results.
Joshua Crittenden studied use of proxies for severe weather in Climate Forecast System Version 2 forecasts to assess their utility in aiding Storm Prediction Center forecasters with creating Day 4–8 outlooks. Statistics were calculated for January through June of 2013. SPC Outlooks and Filtered Storm Reports were used to assess forecast quality for May and June 2013. Cases studied indicated some consistencies in a severe weather proxy that may help SPC forecasters provide more specific severe weather information in Day 4–5 forecasts.
Kody Gast conducted a survey of visitors to the National Weather Center to evaluate what people knew about tornado damage mitigation and whether they had taken any actions to mitigate against tornado damage to their homes. Kody’s study may have been the first such study ever conducted to better understand how tornado mitigation is understood and perceived by the public. Overall, survey respondents were unfamiliar with terminology typically used in mitigation, and few had applied any the mitigation measures recommended. The REU mentors expect to publish this work in a refereed AMS journal. More importantly, however, this work will help guide the mitigation community in how to better shape their public engagement in the promotion and adoption of these measures more broadly.
Nicole Hoban studied the feasibility of using Bragg scatter to estimate systematic differential reflectivity biases on operational WSR-88D radars. Current methods are too imprecise because they are subject to a big drop in contamination. Nicole examined six radars in detail for May and June 2013 from 1400–2200 UTC each day, comparing systematic ZDR bias estimates from Bragg scatter to the currently used scanning weather method. Bragg scattering was found to be comparable. Bragg scattering may offer an alternative method for monitoring systematic ZDR biases.
Caleb Johnson interviewed nine National Weather Service meteorologists, three emergency managers, and two broadcast meteorologists about their experiences with Integrated Warning Team activities. His main, preliminary result validated some of the contentions held by Integrated Warning Team proponents: that relationships between emergency managers and broadcast meteorologists tends to be weak. He identified four areas in which future IWTs might consider focusing their efforts to improve their chance of success. While the results appeared somewhat obvious to those who have participated in IWTs, his work now documents these insights for others.
Brianna Lund looked at use of the National Severe Storms Laboratory’s Mesoscale Ensemble (NME) to aid in short-term forecasting of severe weather events. She found that the NME performed comparably to the Rapid Refresh (RAP) model for producing realistic mesoscale environments. Both modeling systems were characterized by relative small errors in their placement of the dryline and the positioning and strength of storm-induced cold pools. The NME is computationally less expensive.
Andrew Mahre looked at whether a set, optimal sampling rate would be useful for obtaining the maximum amount of information possible about the properties of the wind as measured by a sonic anemometer. He analyzed wind data from for separate instruments at 10 Hz, 1 Hz, and 1/3 Hz using spectral analysis techniques and created a power spectrum for each dataset using a Fourier Transform. Spikes in power were present in the power spectrum created from the 10 Hz dataset and decimated versions of the 10 Hz dataset, but might have been from the instrument rather than the wind. No spikes in power were present at any frequency in any other dataset.
Mallory Row examined forecasts from a convection allowing ensemble in an effort to understand what role the individual members play in producing good forecasts. The skill of each member was examined through the early spring to early summer period. She found that some members perform well but overforecast, while others perform somewhat poorly but underforecast, thus the ensemble mean performs well. Understanding why/how the ensemble works — better on the most severe days, somewhat worse on the less severe days — can give forecasters a way to maximize use of the ensemble when it performs well.
2012 Participants:
Daniel Diaz examined the Global Forecasting System (GFS) model forecast skill of the 2011–2012 cold season in the Northern Hemisphere with the hypothesis that relatively large model error is primarily associated with baroclinic Rossby wave packets and the onset of atmospheric blocking events. In his study, he found that a quasi-stationary blocking ridge developed over parts of Europe subsequent to a series of globally propagating Rossby Waves events. While the forecast skill of this blocking ridge was high once it was established, there was relatively little skill leading to its onset.
Veronica Fall investigated the microphysical processes in a winter storm using a combination of ground and satellite weather radars. She quantified the multi-frequency scattering characteristics for hydrometeors existing in the cloud and precipitation. She found that the vertical profile of radar reflectivity varied due to different physical processes; identification of the melting layer was important to retrieve microphysical properties in cloud and precipitation. Her findings are critical to the algorithm development of quantitative precipitation estimation and may help the identification and retrieval of snowfall in cold-season storms.
Hannah Huelsing examined the spatial and temporal distribution of the Asian pre-monsoon and monsoon seasons. She used Satellite remote sensing estimates from Tropical Rainfall Measuring Mission to compare the rain rates from 2010, when flooding was intense, with those from 2005 –2009. The temporal shift between pre-monsoon and monsoon seasons was enhanced in 2010, showing the shift from the deep convection associated with severe storms to the strong, wide convection associated Mesoscale Convective Systems.
Nathan Korfe studied how altering the boundary layer parameterization scheme affected low-level wind speeds in a blizzard event. His preliminary results showed a strong dependence on the choice of scheme, with some schemes strongly underestimating the actual wind speed. This, in turn, affected prediction of white-out conditions that sometimes accompany comma-head storms.
Jon Labriola investigated the relationship between the multi-radar multi-sensor parameters to tornado intensity. For 11 tornado outbreaks that occurred between 2008 and 2011 he found that neither the maximum azimuthal shear value along a tornado path nor total number of people impacted the final tornado rating.
Brittany Recker compared Storm Prediction Center (SPC) convective outlooks (forecasts) to one estimate of real convective activity, the radar-derived probability of severe weather. She assembled a data set of 108 case days during the spring and summer of 2012 (March – July) to compare the SPC forecasts and radar-estimated severe weather. She found that about 12% of the area within SPC's Slight Risk or greater outlooks was covered by non-zero, radar-estimated probability of severe hail.
Astryd Rodriguez's research project explored forecasters' perceptions regarding uncertainty in weather forecasting. She found that forecasters lacked a conceptual model of uncertainty and defined uncertainty in two ways: unknown outcomes next versus multiple possible outcomes. They expressed uncertainty using primarily hedging terms (e.g. possible, may occur, etc). In general, they preferred to express uncertainty in words over graphics, which were deemed overly confident.
Rebecca Steeves compared the relative performance of several mesoscale analysis systems with applications to severe weather forecasting, by exploring the ability of each to reproduce soundings collected during the Verification of the Origins of Rotation in Tornadoes Experiment 2 (VORTEX2). She found that model soundings derived from the ensemble-based products (i.e., those utilizing groups of forecasts) generally produced smaller errors than those systems that utilize single, deterministic forecasts.
Phillip Ware evaluated a total lightning algorithm currently under development for implementation in operations using high resolution storm reports. For the eight cases examined, he found that using the high resolution storm reports modified verification statistics from those that had only used reports available from NOAA's Storm Data database. His results showed a decrease in the probability of detection and reduced lead time; however, he also showed a reduction in the false alarm rate.
Hope Weldon researched a variety of sources to fill in the approximately 10% of missing information in the database of tornado fatalities. She then did some preliminary assessments of risk for different demographic groups. The four groups at the greatest risk were the elderly, males, people living in the southeast US, people inside mobile homes.
2011 Participants:
Rebekah Banas considered operational forecasts of heavy precipitation events along the Sierra Nevada mountains of California. She found that the precipitation amounts are consistently under predicted and that forecast quality lessens as elevation is increased.
Eric Beamesderfer compared storm motion estimates to observed storm motions for different storm modes and environments. Eric found that storm motion estimates were fairly inaccurate, with deviations up to 20 m s-1 very common. He also found that storm-relative helicity influenced storm motion the most. However, since SRH is heavily tied to storm mode, it was hypothesized that storm mode might be the most important predictor of motion.
Amber Cannon successfully completed a GIS analysis that helped her to compare rates of incidence of fatality, by population density, for two tornado outbreaks affecting Alabama. She successfully manipulated datasets from several different sources, and included raster, vector, and photographic information in her analysis.
Tracey Dorian examined daily MODIS imagery to estimate whether our cloud detection algorithm was producing accurate estimates of mean cloudiness over different regions of the globe. She determined that our original procedure significantly underestimated stratus estimates, and recommended new threshold values.
Travis Elless successfully run the operational global data assimilation and forecast system to study the impact of Aqua data on hurricane track forecast of Danielle (2010). He found the assimilation of AQUA data improved the intensity track of Hurricane Danielle.
Sam Lillo took the first systematic look at supercell storm forecast variability resulting from sensitivity to parameters within a multimoment bulk microphysics scheme. The goal was to identify some parameters or parameterizations that could be diversified provide smooth (as opposed to multi-modal) spread in forecast ensembles. Focus was put on large ice (graupel and hail) characteristics, for example fall speed, rime density, and upon warm-rain physics response to cloud condensation nuclei.
Alex Lyakhov used the RaXpol, a state-of-the-art dual-polarimetric mobile radar to investigate a supercell and weak tornado. His research documented rapid changes in tornado and mesocyclone evolution during tornadogenesis and tornado dissipation and their relationship to polarimetric supercell signatures.
Using high-resolution SHAVE hail reports, Sarah Mustered investigated radar and environmental parameters to determine hail size at the surface. Sarah found that more novel matching techniques will be necessary given the high-resolution reports might match different parameters to wide distribution of hail sizes. She also found that while combinations of radar and environmental parameters did not stratify hail size well, there were certain parameter spaces more favorable to large hail production.
Highlights of Adam Taylor's work include a comparison of Oklahoma Mesonet surface wind speeds with radar-derived estimates from WSR-88D and CASA. Adam tested the impact of dual-Doppler and wind profile corrections to radar-derived estimates when comparing against surface wind observations.
Previous Grant, 2007-2010
Listed first are particularly notable research results from REU participants' work. Skip down to accomplishments of all participants in the 2007-2010 grant.
Special Research Nuggets
The items here are especially significant outcomes of REU projects.
2010 Participants:
Deficiencies in boundary layer parameterizations may hurt model forecasts of shallow cold air.
William Leatham investigated eleven model forecasts for events that included arctic air arriving in the southern Plains in advance of winter storms. The average error for position of the freezing line was quite large and increased with time (up to 135 km at 24 hours). A preliminary investigation revealed that radiative schemes may be a strong contributing source to the error. Precipitation was often well forecast in space and time, and model soundings became saturated to the wet bulb temperature. But the models allowed too much heating of the boundary layer so that the sounding was too warm prior to the onset of precipitation. In at least one instance, the GFS and NAM models forecast the freezing line to retreat more than 30 km northward during the peak of the solar cycle, while the observed freezing line progressed an equal amount in the opposite direction (southward).Defining Spatial Vulnerability From Tornadoes Based on Fujita Scale
Eric Hout's research defined the idea of spatial vulnerability of counties based on the standardized tornado fatalities for individual counties over time. Previous studies on tornado vulnerability have provided insight on how individual factors influence overall social and spatial vulnerability. However, few studies have been conducted to evaluate the aggregated effect on vulnerability when these factors coincide. Additionally, a definition of vulnerability has been absent from the meteorological literature. Thus, to provide a more comprehensive view of vulnerability, this study proposes a mathematical definition for spatial vulnerability, and then uses tornado casualty data from 1950 through 2009 to calculate vulnerability on a county level for seven time periods. Hout analyzed trends of spatial vulnerability for each county and interpreted the spatial patterns among counties with increasing or decreasing trends of spatial vulnerability. Some patterns could be attributed to regional and others to local effects, which suggest regional and local influences on social responses to tornadoes of different damage (Fujita) scales.Incorporating Societal Impacts into Development of Warn-on-Forecast
The National Severe Storms Laboratory has begun research to move towards a Warn-on-Forecast (WoF) system. WoF will include probabilistic information from ensemble model forecasts and forecaster input with much greater lead time than today's current warnings. Sarah Stalker's research was the first to address some of the societal impacts of moving to a WoF system. She interviewed six individuals in the Norman, OK region who were affected by the 10 May 2010 tornado outbreak. Subjects noted that seeing a projected path of the storm, similar to that provided by graphical hurricane outlooks, was more important than the additional lead time to them. Further research will develop upon these results and help tune WoF products throughout their development.
2009 Participants:
Advanced modeling techniques help forecasters stay in tune with snow band prediction.
Banded snow is one of the greatest winter weather forecasting challenges faced operationally with large economic and human safety consequences. Numerical models frequently fail to provide forecasters with adequate guidance to anticipate banded snow. Using techniques normally applied to springtime convective events, Astrid Suarez Gonzalez demonstrated that a combination of high-resolution, data assimilation and ensemble forecasts can greatly aid in the forecast decision-making process.Low-level Scanning Could Be Key to Reducing NWS Tornado False Alarms
Hannah Barnes investigated NWS tornado warning statistics for marginal storm events. Hannah quantified the false alarm rate (FAR) and probability of detection (POD) for three scenarios: i) days with no reported tornadoes; ii) days with only one reported tornado; and iii) outbreak days with ten or more reported tornadoes within a Weather Forecast Office county warning area. Hannah identified three key results. First, the large-scale environment differed little between zero and one tornado days, but both differed significantly from large outbreak events. Thus, there were no large-scale signatures differentiating between zero and one tornado days. Second, the circulation intensity of false alarms at the lowest height , as scanned by WSR-88D radars, was notably weaker than those associated with confirmed tornado warnings. Third, the presence of obscured velocity data (marked by ‘purple haze’) led to a 15% increase in the false alarm rate. Hannah’s findings are critical first steps in understanding how to reduce the number of tornado false alarms. These findings may determine how future radar systems are deployed and how optimal scan strategies could be utilized.One to two hour tornado warning lead-time may not be necessary for general public
Stephanie Hoekstra's research provided insight into whether a 1-2 hour tornado warning lead-time (also known as warn on forecast) is currently demanded by the general public. On average, participants stated needing a minimum lead-time of 13.8 minutes but would like 33.5 minutes in an ideal situation. Her work is significant because while longer lead-times are often the focus of meteorological research, little to no research has been published regarding how the public would respond to such a warning. Stephanie and her mentors are aiming to publish her results in a peer reviewed journal.NWS Lead Time for Severe and Damaging Hail Adequate for Preventive Measures
Lauren Potter quantified NWS warning lead times for reported severe hail and damaging hail events. Lauren compared two years (1999 and 2000) of severe hail reports and ten years (1999-2008) of damaging hail reports from Oklahoma, Colorado, Massachusetts and South Carolina. Interestingly, she found no significant differences among those states in the lead time of reported severe hail or damaging hail. The mean lead time for severe hail was 18-22 minutes, with a lead time ranging from 19 to 29 minutes for damaging hail across the four states. Overall, Lauren found that about 72% of reported hail occurs during a Severe Thunderstorm warning and another 7% occurs during Tornado Warnings. Such a relatively long lead time and warning rate provides the general public and emergency and government services with the opportunity to take preventive cautions and thereby mitigate at least some property damage from hail.Exploring Viability of Social Networking to Communicate Weather Information
In order to begin developing an understanding of social networking as a means for communicating weather information to the general public, particularly with regard to time-critical information about severe weather, Justin Wittrock developed and distributed a web-based survey designed to address fundamental questions about this issue. In contrast to many REU projects, which represent student participation in an ongoing research program established previously by the mentor, Justin’s project was self-initiated. He learned how to develop an effective survey and in particular, how to pose questions in a neutral manner. He also gained experience in the Institutional Review Board process, learned how to identify communities and sample them in appropriate ways, and how to apply statistical analysis techniques. Most importantly, he was shown how to explain findings, rather than simply present them, and pose questions for further study based upon them.
2008 Participants:
Tornado Warning Performance Dramatically Improves Inside a Tornado Watch
Kelly Keene's research showed that having a tornado watch in place prior to the issuance of tornado warnings vastly improves the performance measures associated with tornado warnings, particularly the critical measure of probability of detection (POD). Specifically, when a tornado watch is in place, the average POD for tornadoes over the last 10 years is around 0.85, while when no watch is in place the POD drops significantly to 0.50. This drop in POD suggests that not having a watch in place prior to a tornado warning equates to where the warning performance was some 20 years ago just prior to the implementation of the Doppler radar network.Model of New York Harbor Improving through Ensemble Data Assimilation
The New York Harbor Observing and Prediction System (NYHOPS) is being upgraded (funded by the Navy's Small Business Innovation Research (SBIR) program) to make better use of observations routinely collected in New York Harbor. Jon Poterjoy's project on ensemble Kalman filter localization accomplished, by hand, what will become an automated procedure that maximizes the impact of a wide variety of ocean observation systems deployed in New York Harbor.
2007 Participants:
Student Discovers Error in Data
As Doug Crauder was scoring his velocity products looking for velocity dealiasing errors, he came across a situation where there were noisy velocities in a meteorologically benign area near the radar. Doug realized these noisy regions had the classic teardrop shape associated with range folded echoes. A closer look identified strong storms in the fourth Doppler trip were causing the problem. Normally the range folded data should be shown as "purple haze." In this case the new range aliasing mitigation technology developed by Sachidananda and Zrnic (SZ-2) is not correctly sorting the data. National Severe Storm Laboratory scientists agree they will need to tweak threshold parameters to clean up the data.Type of Weather Watch Affects Warning Performance
Jessica Ram's research showed that the type of watch issued by the Storm Prediction Center affects warning performance at local National Weather Service Forecast Offices. Specifically, tornado warning performance was highest for Particularly Dangerous Situation (PDS) Tornado watches, and lowest when no watch of any kind was in effect. The study also showed that 93% of all tornado events occurred inside some type of watch, with 3/4 occurring either in a PDS tornado watch or a tornado watch. An interesting result of the forecaster survey is that watch type seems to influence an individual warning threshold, such that it is lowest for a PDS tornado watch.Long-Term Changes in Atmospheric Instability Could be Related to Increasing Temperatures
Victor Gensini found that there are long-term changes in the frequency of high instability in the atmosphere in the US, with high values occurring at the beginning and end of the analysis period associated primarily with increased low-level moisture. To first order, trend resembles the US annual temperature record, implying that it could occur more frequently in a greenhouse-enhanced climate. In South America, on the other hand, instability decreased throughout the period, dominated by drying conditions.Students' Dataset Forms Basis of Competition
The storm classification data set created as part of Eric Guillot's REU project is being used in a competition sponsored by the Artificial Intelligence Committee of the American Meteorological Society at their 2008 annual meeting.
Highlights of Student Research Accomplishments
2010 Participants:
With current and anticipated climate change, there arise questions related to how the hydrologic cycle may be affected in a region. Using a GCM ensemble Christopher Bednarczyk studied potential changes to the Blue River Basin of Oklahoma. Depending on the emissions scenario, streamflow is projected to decrease 10 to 30%. This is important because several area communities get water from this river, and there has also been talk of outside communities pumping water to supplement their own future water supplies.
Jeffery Deppa studied WRF model forecasts of the low level jet (LLJ) over a wind farm in southwest Oklahoma. As part of his investigation of mountain wave dynamics he studied parameters such as the Froude number and used IDV to visualize the forecasts. The WRF forecasts indicated that the strongest winds at turbine height might actually occur a few kilometers downstream of the ridgetop wind farm.
Todd Ferebee investigated the use of multi-radar, multi-sensor severe weather products in determining where different hail categories did or did not fall. He found several products did fairly well in depicting where no hail, non-severe hail, severe hail and significant-severe hail fell. Several other products showed delineation between just two categories, such as non-severe hail vs. severe hail or significant-severe hail vs. all other categories. Todd gained experience with the R statistical program and the Warning Decision Support System--Integrated Information command line utilities.
Stacey Hitchcock learned the importance of programming knowledge, writing skills, and data visualization in meteorological research. She also learned several different forms of forecast verification, including the use of Performance Diagrams (Roebber Diagrams) to convey large amounts of information succinctly in a single figure.
Eric Hout's research defined the idea of spatial vulnerability of counties based on the standardized tornado fatalities for individual counties over time. Previous studies on tornado vulnerability have provided insight on how individual factors influence overall social and spatial vulnerability. However, few studies have been conducted to evaluate the aggregated effect on vulnerability when these factors coincide. Additionally, a definition of vulnerability has been absent from the meteorological literature. Thus, to provide a more comprehensive view of vulnerability, this study proposes a mathematical definition for spatial vulnerability, and then uses tornado casualty data from 1950 through 2009 to calculate vulnerability on a county level for seven time periods. Hout analyzed trends of spatial vulnerability for each county and interpreted the spatial patterns among counties with increasing or decreasing trends of spatial vulnerability. Some patterns could be attributed to regional and others to local effects, which suggest regional and local influences on social responses to tornadoes of different damage (Fujita) scales. Eric learned the process of developing a research project with an emphasis in GIS and spatial vulnerability of tornadoes. He experienced the entire research procedure: defining a research question, literature review, data acquisition, analysis, and interpretation. He has learned GIS skills in data integration and spatial analysis.
Christopher Kerr learned to process and analyze CASA X-band polarimetric radar data and made comparisons between the radar measurements and calculated radar variables from disdrometer data. He calculated mean biases and errors of the measurements for the radar data with and without attenuation correction. The biases and errors are significantly reduced with attenuation correction, but substantial residual errors exist even after the correction. The residual errors vary depending on the location of the storm and the propagation path through the storm. This indicates that the attenuation effects have not been fully accounted for and further study is required.
Major ice storm events have become a seemingly routine component of southern U.S. winters during the past decade. In order to determine where and how frequently ice storms have occurred during the past decade, Carly Kovacik conducted a climatological analysis of ice storm events across the southern United States. Her research accomplishments included the development of a 10-year dataset of ice storm events across the southern U.S. (specifically KS, MO, OK, AR, TN, TX, LA, MS), an analysis of events to determine spatial and temporal characteristics, and a preliminary investigation into atmospheric mechanisms potentially responsible for changes in ice storm frequency observed during the past decade. Carly quantified an ice storm maxima within a region stretching from far southwest Oklahoma northeastward through Missouri. One particularly important result of this research revealed significant geographical inconsistencies in ice storm frequencies across National Weather Service Forecast Office boundaries. Although limitations in the National Climatic Data Center’s Storm Storm (and Storm Events) archives are known, this result emphasized the lack of a universal definition for ice storms nation-wide. Through this project Carly gained skills in building datasets, analyzing phenomena spatially, and effectively communicating results orally and in writing. The work she accomplished is already contributing to continuing efforts to study southern U.S. ice storms at the Oklahoma Climatological Survey.
Forecasters have long observed that operational models are too slow with the southward progression of shallow, arctic air across the sloping terrain immediately east of the Rocky Mountains. This deficiency affects forecasters’ confidence in forecasting precipitation type and issuing winter storm warnings at lead times of only 12 to 24 hours. William Leatham set out to quantify the problem. Inspecting eleven model runs related to four winter storms, Bill found an average error of about 60 km on the location of the cold front and, more importantly, 107 km on the location of the surface freezing line. Freezing line error increased from east to west, and, as expected, the model error was toward the north. Twenty-one hours into one forecast, much of the freezing line from Oklahoma City to the New Mexico border was observed farther south than any of the twenty-two members of the Short Range Ensemble Forecast (SREF) had forecast. With a robust ensemble, this result should be rare, and finding this result with a case sample size of one is troubling. Preliminary inspection found that diabatic influences may play a large role in creating model error with respect to the freezing line. Building a larger data set will help confirm whether a strong model bias exists, and testing sensitivity to diabatic processes may provide insight into potential causes.
Sarah Stalker investigated public actions and reactions to the 10 May 2010 Norman, Oklahoma tornado. Sarah showed great poise and enthusiasm throughout the summer and acted as a self-starter in order to get her research accomplished in the limited time-period of the REU program. She learned how to work through the Internal Review Board (IRB) process, which included a detailed training and developing a description of her research process and goals. Interviews were completed with individuals living in the path of the tornado in order to gain perspective on what they choose to do and why during a tornado. A qualitative research technique (thematic analysis) was used to analyze her data and associate with past work via a conceptual model. Participants did not feel any direct threat during early storm development and advisories and waited until the final moments to take shelter, though all subjects later believed they should have taken action sooner. Participants also stated that information on the projected storm-track, similar to that provided by graphical hurricane outlooks, was more important to them than longer lead-times. Sarah continued this project after REU, adding participants in Minnesota following the tornado outbreak that occurred in that region on 17 June 2010. She will present her work at the Sixth Symposium on Policy and Socio-Economic Research at the upcoming 2011 AMS Annual Meeting.
Joshua Turner investigated whether the urban heat island affects storm trajectories. He analyzed output from a cloud tracking algorithm that provided locations and size of storms throughout their lifetime. The goal was to see if changes in storm velocity (both direction and speed) were correlated to urbanized centers. A threshold filter was applied to eliminate spurious results from different storms joined together. There was no clear relationship of changes in velocity to urbanization, but signals may have been swamped by noise due to the time limitations in developing the thresholding filter. Josh’s MatLab programming techniques were greatly expanded during this project.
Available datasets of global wetlands, water bodies, and seasonally inundated areas do not meet the needs of greenhouse gas flux models, which are used to estimate the flow of trace gases such as methane from the land surface into the atmosphere. Kevin Van Leer contributed to efforts to develop advanced water mapping techniques by investigating the effect that pixel scale has when flooded area is determined from satellite remote sensing imagery. Kevin's research showed that classified coarse-resolution imagery from the Moderate Resolution Imaging Spectroradiometer (MODIS, 250- to 2000-m) can significantly underestimate total inundation area compared with fine-resolution Landsat imagery (30 m). Furthermore, he showed that 250-m MODIS imagery did not improve the inundation area estimate compared with coarser-resolution imagery. Through this project, Kevin developed skills in spectral analysis, image classification, and spatial analysis of satellite imagery. He also gained experience in the Matlab programming environment and in the handling of large remote sensing datasets.
The Storm Prediction Center (SPC) has begun to develop a measured severe thunderstorm gust dataset that is partially independent of the National Weather Service's severe weather report database. Andrew Winters played an integral role in the development of the measured wind dataset by parsing surface observation data and then subsequently analyzing spatial relationships in a Geographic Information System framework and analyzing near-storm environmental variables linked to each individual gust. Through his work, the SPC is in the early stages of obtaining an objective, non-damage biased severe thunderstorm wind gust climatology. Preliminary results show measured severe wind gusts to be most frequent in the Plains and portions of the Midwest. This is in contrast to the severe thunderstorm wind database showing the maximum in severe thunderstorm wind gust/damage frequency over the Appalachians. It was found that a much lower frequency of measured wind gusts exists there compared to the Plains. Through this work Andrew increased his skills in manuscript writing, oral presentations, statistical methods, and Geographic Information System analysis techniques.
2009 Participants:
Hannah Barnes investigated NWS tornado warning statistics for marginal storm events. Hannah quantified the false alarm rate (FAR) and probability of detection (POD) for three scenarios: i) days with no reported tornadoes; ii) days with only one reported tornado; and iii) outbreak days with ten or more reported tornadoes within a Weather Forecast Office county warning area. Hannah identified three key results. First, the large-scale environment differed little between zero and one tornado days, but both differed significantly from large outbreak events. Thus, there were no large-scale signatures differentiating between zero and one tornado days. Second, the circulation intensity of false alarms at the lowest height , as scanned by WSR-88D radars, was notably weaker than those associated with confirmed tornado warnings. Third, the presence of obscured velocity data (marked by ‘purple haze’) led to a 15% increase in the false alarm rate. Hannah’s findings are critical first steps in understanding how to reduce the number of tornado false alarms.
Wind ramp events – abrupt changes in wind power output due to variations in wind speed – are a growing concern in the wind power industry. Kristen Bradford examined the climatology of wind ramp events at 34 METAR sites in the Southern Plains during June-July 2009. The observations were used to validate Weather Research and Forecasting (WRF) model forecasts on a 3-km grid. Owing to the paucity of instrumented tower data, 10-m winds were used for the study. The WRF model performed well during frontal passages but did not capture the temporal variability of the observations. Similarly, although there little overall bias in the forecast wind speeds, many more ramps were noted in the observations owing to the temporal variability.
David Gorree collected 20 years of 1-km resolution, biweekly maximum-value composite normalized-difference vegetation index (NDVI) data from polar orbiting satellites over the contiguous United States and converted the data to vegetation fraction for periods centered near 1 April and 1 May. Analyzed these data to produce mean, maximum, minimum, and standard deviation fields and explore interannual vegetation variability. Developed improved skills in programming languages and visualization tools.
Stephanie Hoekstra got a taste of what it is like to integrate social science into meteorology. She looked at how the public perceives severe weather as well as whether tornado warning lead-times longer than the current average lead-time (about 13 minutes) are in demand. She surveyed National Weather Center (NWC) visitors ranging from 18 to 65+ years of age. Many social science studies only sample undergraduate students, so the broad range in ages is noteworthy. Stephanie found that her sample population perceived weather risks and fatalities fairly accurately, but interesting patterns were emerging for the way different age groups or people from different areas perceived and ranked these risks. She also found that the participants would prefer a tornado warning lead-time of at least 13.8 minutes, with an ideal lead time of 33.5 minutes. Stephanie learned about creating surveys and the difficulties that can accompany that process. Additionally, she learned some introductory methods for analyzing survey data, as well as ways to correlate the perceptions of those surveyed to the climatology of severe events.
Alex Kowaleski evaluated lightning and severe thunderstorm forecasts from the European Storm Forecast Experiment (ESTOFEX). He found that between-forecaster variability is about the same or less than between-season variability, suggesting that the ESTOFEX forecasters put out products that look like they come from a single unit rather than individual forecasters. By utilizing new approaches to visualization of forecast performance, Alex was able to show the progression of forecast performance through the year and between different years. Such techniques will be applied in the future to forecasts from the NWS Storm Prediction Center.
Lauren Potter quantified NWS warning lead times for reported severe hail and damaging hail events. Lauren compared two years (1999 and 2000) of severe hail reports and ten years (1999-2008) of damaging hail reports from Oklahoma, Colorado, Massachusetts and South Carolina. Interestingly, she found no significant differences among those states in the lead time of reported severe hail or damaging hail. The mean lead time for severe hail was 18-22 minutes, with a lead time ranging from 19 to 29 minutes for damaging hail across the four states. Overall, Lauren found that about 72% of reported hail occurs during a Severe Thunderstorm warning and another 7% occurs during Tornado Warnings. Such a relatively long lead time and warning rate provides the general public and emergency and government services with the opportunity to take preventive cautions and thereby mitigate at least some property damage from hail.
Astrid Suarez Gonzalez considered numerical forecasts of banded snow. Banded snow is one of the greatest winter weather forecasting challenges faced operationally with large economic and human safety consequences. Her work focused specifically on using techniques that have been successfully used to improve forecasts of springtime convective systems: namely, convection-permitting forecasts, ensemble forecasts, and data assimilation. The work she did is quite unique: Some people argue that winter phenomena may not be as sensitive to these techniques because the flow is usually forced by larger-scale processes. However, Astrid demonstrated that these techniques can greatly improve a forecast. Astrid came to REU with a great interest in anything related to numerical modeling. She had never heard of data assimilation before but was really enthusiastic to learn and try and is now very interested in this research area.
Cristal Sampson (funded through CUNY's REU) conducted evaluation research on existing user feedback surveys from the ongoing research and development of the National Weather Radar Testbed's Phased Array Radar (PAR). The PAR is a research radar that is under consideration to replace the Weather Surveillance Radar-1988 Doppler (WSR-88D). As a new technology it is important to provide user insight into the development stage to ensure intended users have the most usable tool upon deployment and not only understand the operational utility of PAR. Results from experiments held in 2008 and 2009 have already assisted researchers developing PAR. The participants of these experiments evaluated real-time and archived cases; after each evaluation questionnaires were completed. The responses to two archived cases were analyzed in this paper using a data-driven method. The results show how high-temporal resolution data of PAR impacted the participating forecasters in a simulated warning environment. Suggestions are made to improve future research and development.
Jeff Viel performed a robust statistical analysis of temperature time series data of US cities for which there are weather contracts that trade on the Chicago Mercantile Exchange. Jeff was able to utilize Fourier decompositions of the data to remove the seasonal signal in the first and second statistical moments, leaving a distribution of historical residuals. Jeff demonstrated that the residual distributions are, in most cases, not drawn from a normal population. This finding is very important, for it has implications on the way in which options on weather futures contracts could be priced. Then, using the statistics, he developed a stochastic model that attempts to simulate realistic temperature paths for the eventual purpose of incorporation into a pricing model. The preliminary results of Jeff's model seem very promising.
Travis Visco used a new least, linear squares derivatives (LLSD) technique (developed at NSSL) to derive azimuthal shear and radial convergence fields. He compared the shear and convergence fields to tornado tracks to form a distribution. His study represents the first such effort to obtain these distributions of the derived LLSD fields. Travis also separated out the first tornadoes from storms in our database. By doing this, he could isolate (i.e., avoid interference from ongoing tornadoes) trends in the fields prior to tornado touchdown. These trends showed a general increase in azimuthal shear prior to tornado touchdown, especially in the leading 5 to 10 minutes. Travis' most significant find was the large spread in the distribution of azimuthal shear values.
Jonathan Vogel conducted a survey of NWS meteorologists to assess the impacts of super-resolution radar data on signature recognition and warning-decision making. The majority of meteorologists surveyed indicated that they did see an improvement in signature recognition for various signatures noted in the literature (i.e. gust fronts/boundaries). When it came to warning-decision making, the meteorologists were a little more reserved in their comments because they wanted to give super-resolution data a little more time before making a judgment. Jonathan gained valuable experience in developing and conducting human surveys. He also gained experience in analyzing radar data.
In order to begin developing an understanding of social networking as a means for communicating weather information to the general public, particularly with regard to time-critical information about severe weather, Justin Wittrock developed and distributed a web-based survey designed to address fundamental questions about this issue. In contrast to many REU projects, which represent student participation in an ongoing research program established previously by the mentor, Justin’s project was self-initiated. He learned how to develop an effective survey and in particular, how to pose questions in a neutral manner. He also gained experience in the Institutional Review Board process, learned how to identify communities and sample them in appropriate ways, and how to apply statistical analysis techniques. Most importantly, he was shown how to explain findings, rather than simply present them, and pose questions for further study based upon them.
2008 Participants:
Blake Allen investigated the effects of enabling prediction of a second microphysical moment, number concentration, for each hydrometeor category in a mixed phase, bulk microphysics scheme in a cloud-resolving numerical prediction model. The electrification of the storm was also found to be quite sensitive to changes in the microphysics complexity, due at least in part to variations in cloud ice and graupel production in the different model runs. Along the way, he learned about scientific computing in a UNIX environment, using 3D visualization tools, and helped uncover errors in the model code as it was being developed.
Severe weather watches are a part of a series of products issued by the Storm Prediction Center (SPC) that are used to alert forecasters, emergency managers, the media, and the public of the likelihood of the occurrence of severe weather. What makes severe weather watches important is their ability to help improve public safety and help save lives as they make people aware of the potential danger of severe weather within their area in the hours immediately following the issuance of the Watch. Becky Belobraydich surveyed the college students at Northern Illinois University and The University of Oklahoma. The students' responses were then analyzed to see what they knew about Watches and how they responded to them. The responses were right in line with what we thought they would be, and they point to the fact that the majority knew there county but did not know the counties next to them. More research and public education is warranted to get the SPC Watches to the full effect.
Tim Bonin looked into the notion that we have experienced more ice storms in the southern plains in recent decades, compared to prior history. His research combined two large datasets: the climatological record of winter precipitation and upper-air data that informs it. He did a solid job of working around, and reasoning through, some limitations of the data. His results showed that the precursors for icing events remained largely unchanged, but the scenarios that potentially support high-end events may have increased in the last decade.
Madison Burnett focused on evaluating the amount of tornado activity that occurred during the autumn and winter months of 2007-08 and comparing that activity with the historical record of tornadoes and tornado-related fatalities. She discovered a substantial upswing in all tornado reports over the past 50 years but very little change, to a slight downward trend, in the strongest and most violent tornadoes reported during the cool season months over this same period of time. Further analysis revealed that cool seasons with a large number of tornado-related fatalities have appeared in the record about once a decade over the past 50 years. In order to conduct this work, Madison had to become proficient not only in the format of the NWS/SPC tornado database but also in the use of the structured query language used in evaluating tornado data contained within the database. In a side project comparing the SPC and NCDC tornado databases, Madison uncovered a peculiar inconsistency where extra counties existed in the SPC database for tornadoes tracking up to and perhaps crossing a county border. This inconsistency was most noticeable for a period of the 1970s and may have been due to different tornado coding standards used at the time. Further investigation into this issue is needed.
Brad Hegyi applied lake-effect snow forecasting parameters to lake-effect snow cases on the west side of Lake Michigan to see if those parameters were helpful in forecasting those relatively rare lake effect events. He found that northeast and north-northeast winds at 850 and 925 mb were common to western Lake Michigan lake-effect snow events, in addition to a minimum of a 13°C temperature difference between 850 mb and the lake surface.
Christina Holt investigated the physical characteristics of a tornado producing mini-supercell that occurred over Oklahoma during tropical storm Erin. The mini-supercell had a shallow circulation only 4.5 km in diameter that extended through a depth of only 3 km. These physical attributes are consistent with previous studies of similar storms. Christina's study was unique in that she was able to use data from the Multifunction Phased Array Radar (MPAR), operating in Norman, OK, to sample the rapid intensification to a tornadic phase. This transition took only 3 minutes. The case serves as an example of how higher temporal sampling might improve hurricane-spawned tornadoes and improve forecasts and warnings of them.
Kelly Keene examined tornado warning performance in relation to watches for 1997-2007. Her database consisted of over 30,000 tornado warnings and over 15,000 tornadic events. She found that the issuance of any watch improves the overall tornado warning performance. She found that the Probability of Detection (POD) of tornado warnings increases by .327 when a tornado watch is in effect, as opposed to when no watch is in effect. Lead time from tornado warning occurrence is improved by an average of five to six minutes when a tornado watch is in effect, as opposed to no watch. Finally, when a tornado watch is in effect, there is a slight decrease (in the amount of 0.81) in False Alarm Ratio (FAR) compared to when no watch is in effect.
Jennifer Newman analyzed data from nine interviews with meteorologists from two key stakeholder groups in the Southern Plains, NWS forecasters and TV broadcasters, to attain specific information about current radar capabilities and how those capabilities helped or hindered participants' ability to fulfill their roles. Her analysis revealed that the problems participants spoke of fell into four basic needs. First, meteorologists clearly conveyed the need for reliable, clean, and accurate radar data. Second, several stories involved weather situations that evolved more rapidly and on smaller spatial scales than WSR-88D can sample. Third, both groups told stories illustrating advantages of high-resolution and low-altitude station or TDWR radar data, and how the lack of that information in other areas hampered their awareness of the weather that was occurring. Finally, size, distribution and type of hydrometeors in both warm and cold season events were critical information participants could only partially infer in data from current radar systems.
Jonathan Poterjoy's project addressed a fundamental question about using observations to improve ocean models: what area/volume within an ocean model should a single observation influence? His work shows that the answer varies widely depending on the local bathymetry, depth and by variable, and importantly, that there are high correlations at great distances from the observation that are spurious and must be trimmed (i.e., localization). His work also shows that some cross variable correlations (i.e., salinity/temperature) are significant. With the knowledge generated by Jonathan's project, there is a now benchmark for devising automated methods to calculate localization distances.
Christopher Wilson successfully used a high-resolution hail verification dataset to evaluate several hail diagnosis techniques. Chris's project may also be one of the first projects to use lead time, in a meaningful way, in algorithm performance evaluation. Chris tracked observed hail sizes and storm attributes at discrete times (i.e., a radar volume); this is in contrast to other studies which arbitrarily relate storm attributes to hail sizes by using a time window (e.g., +/- 20 min). While different diagnosis techniques had high probability of detection and low false alarm ratio scores, which hint at good performance, relatively high probability of false detection scores hampered overall performance (determined by Heidke Skill Score). Finally, Chris showed that for lead times greater than 10 min, all evaluated hail diagnosis techniques showed poor skill.
Jeff Zuczek investigated the climatology of when weather would likely be favorable for prescribed burning. Such burns are critical for controlling invasive plants, including the Eastern Red Cedar, which is notorious for breaking up pastureland and wildlife habitats. Wind climatology using Oklahoma Mesonet data from January 1994 through May 2008 was analyzed to determine the number of days each year meeting all criteria for prescribed burns, using a consensus definition for "favorable burn day" from Oklahoma's 11 burn associations. Jeff's results showed good burning conditions were more likely earlier, rather than later, in the burn season.
2007 Participants:
Rachel Butterworth took the opportunity to work on developing a proposal that, if funded, could lead to hear master's degree. Whether or not that might come to pass, she learned a great deal about how to research and develop a proposal. She took her initial idea of addressing the gaps in scientific literacy among the general public with the anticipated capabilities of new radar technologies such as the CASA concept and developed an education and communication plan to that would help people take advantage of weather technology in their daily activities.
Douglas Crauder successfully demonstrated the feasibility of using two rather than three Doppler scans with the Multiple PRF Dealiasing Algorithm when one of the two Doppler scans uses the phase coding logic developed by Sachidananda and Zrnic to mitigate range aliasing. The significance of using two rather than three Doppler scans is that nearly thirty seconds can be removed from the time required to complete a volume scan of data which is normally between five and six minutes. During severe weather a reduction of thirty seconds is important to operational forecasters who want a rapid update for assessing storms. The Applications Branch expects to submit change requests to the WSR-88D system to add new volume coverage patterns based on his findings.
Victor Gensini analyzed time series from 1958-1999 of high values of atmospheric variables important for severe thunderstorms in regions of North and South America, based off of NCAR/NCEP reanalysis data. He learned how to look at cumulative distribution functions of very large datasets in an efficient manner, so that comparisons between different periods and locations could be assessed.
Eric Guillot found that the amount of forecast skill involved when issuing tornado and severe thunderstorm warnings is closely related to the type of storm that causes the severe weather. It was found that, for a sample of over 3000 warnings, both tornado warnings and severe thunderstorm warnings issued for isolated supercells and convective line storms have better skill scores than those issued for pulse and non-organized storms. Lead times were consistently longer for supercell and line storms, while usually very short for pulse and non-organized storms. We concluded that measures of forecast skill are particularly sensitive to the type of storm. Thus, any measurement of forecast skill, such as the year-over-year skill measure of an individual forecast office, has to take into account the types of storms in that office’s warning area in the time period considered. This project focused on the analysis of multi-radar, multi-sensor data from convective storms, statistics, and severe weather verification techniques.
Stephanie Henry helped to develop a procedure for determining cloud forests in Central America using MODIS imagery with 250m spatial resolution. Cloudiness was extracted from the visible images via an algorithm and this cloudiness was further stratified by its annual and diurnal variations. Together these allowed the mapping of regions of differing cloudiness, which could then be related to cloud forests estimated via other means. The procedure can be applied globally to map different vegetation regimes based on the satellite observed cloudiness.
Luke McGuire developed a tool that allows us simulate satellite orbit tracks and sensor field-of-view configurations and project this track onto the globe. Then, using a cloud-cover database, he developed a method to determine for each satellite footprint the probability that the sensor will encounter clouds – and if it does, the expected cloud altitude. This tool allows us to investigate the impact of cloud-cover on satellite configurations. The results can be used to assess the utility of new sensors by allowing for a robust simulation of clouds when we simulate the satellite measurements. Luke wrote an excellent summary of his work and we are in the process of expanding this into a refereed journal paper.
Scott Powell learned a number of social science statistical approaches and how to properly manipulate variables involved in how people make decisions based on weather information. He was very quick to learn a new statistical software package (SPSS), effectively incorporated the valuable tips his mentor, a professor in the Department of Communications, gave him on presentation skills, and wrote a well-formatted, organized, and developed final paper. Scott found that individuals' responses to weather information vary demographically, especially by geography, age, and gender. Californians, for example, reported less planning, readiness, and trust in weather information, no matter the source. Over one third of the sample population did not know the difference between a severe weather watch and a warning.
Jessica Ram successfully quality controlled and organized thousands of storm reports and national weather service issued warnings for over 250 watches from the first few months of 2006. She learned all about 2x2 contingency tables and statistics related to warning and watch performance like false alarm rate, probability of detection, and critical success index. She also received over 40 completed surveys from NWS forecasters all across the country.
Bo Tan worked on developing a strategy to relate satellite imagery to tropical wave positions identified with special radiosonde data collected over West Africa during the NAMMA - 2006 field program. The procedures that Bo explored will be expanded to develop multi-year climatologies based on geostationary satellite imagery that distinguish rapidly developing tropical waves from those that develop slowly, or do not develop. This ongoing study should benefit longer-range hurricane forecasting over the Atlantic.