|
|
|||
|
|
|||
| 100mb | 20mb | 10mb | |
|
(0) 11.15619 (1) 33.48376 (2) 55.84625 (3) 78.24921 (4) 100.6941 (5) 130.6973 (6) 168.2993 (7) 206.0258 (8) 262.9083 (9) 339.2218 (10) 416.324 (11) 494.2875 (12) 573.061 (13) 652.6377 (14) 753.3575 (15) 875.7227 (16) 999.9044 (17) 1125.929 (18) 1297.357 (19) 1516.026 (20) 1740.34 (21) 1970.525 (22) 2231.12 (23) 2523.825 (24) 2826.111 (25) 3138.408 (26) 3461.319 (27) 3795.653 (28) 4142.276 (29) 4502.222 (30) 4909.277 (31) 5367.915 (32) 5851.041 (33) 6362.054 (34) 6945.672 (35) 7610.837 (36) 8327.282 (37) 9104.302 (38) 9896.749 (39) 10646.46 (40) 11407.02 (41) 12172.92 (42) 12951.79 (43) 13732.4 (44) 14517.87 (45) 15284.54 (46) 15891.88 |
(0) 12.17377 (1) 36.53989 (2) 60.94843 (3) 85.40555 (4) 109.9128 (5) 142.6807 (6) 183.7574 (7) 224.9828 (8) 287.1807 (9) 370.7034 (10) 455.1675 (11) 540.6235 (12) 627.0408 (13) 714.4216 (14) 825.1357 (15) 959.7851 (16) 1096.621 (17) 1235.691 (18) 1425.217 (19) 1667.391 (20) 1916.387 (21) 2172.555 (22) 2463.457 (23) 2791.201 (24) 3130.808 (25) 3483.037 (26) 3848.86 (27) 4229.324 (28) 4625.813 (29) 5040.161 (30) 5512.624 (31) 6050.107 (32) 6622.21 (33) 7232.885 (34) 7937.304 (35) 8751.542 (36) 9647.146 (37) 10643.01 (38) 11692.19 (39) 12735.86 (40) 13870.7 (41) 15103.79 (42) 16491.98 (43) 18066.19 (44) 19985.01 (45) 22343.43 (46) 24836.16 |
(0) 12.30045 (1) 36.92014 (2) 61.5827 (3) 86.2948 (4) 111.0581 (5) 144.1694 (6) 185.678 (7) 227.3381 (8) 290.1893 (9) 374.591 (10) 459.9611 (11) 546.3466 (12) 633.7046 (13) 722.0432 (14) 833.9879 (15) 970.1503 (16) 1108.546 (17) 1249.227 (18) 1440.998 (19) 1686.1 (20) 1938.182 (21) 2197.613 (22) 2492.363 (23) 2824.626 (24) 3169.081 (25) 3526.494 (26) 3897.887 (27) 4284.374 (28) 4687.423 (29) 5109.036 (30) 5590.462 (31) 6138.808 (32) 6722.99 (33) 7347.282 (34) 8068.738 (35) 8904.639 (36) 9826.656 (37) 10856.03 (38) 11948.23 (39) 13046.19 (40) 14254.95 (41) 15586.73 (42) 17124.03 (43) 18928.34 (44) 21261.04 (45) 24407.69 (46) 28355.85 |
Hu, X.-M., W. Honeycutt, C. Wang, B. Weng, B. Zhou, M. Xue (2025)
Observation and simulation of methane plumes during the morning boundary layer transition
JGR-Atmospheres,
doi:10.1029/2024JD042317
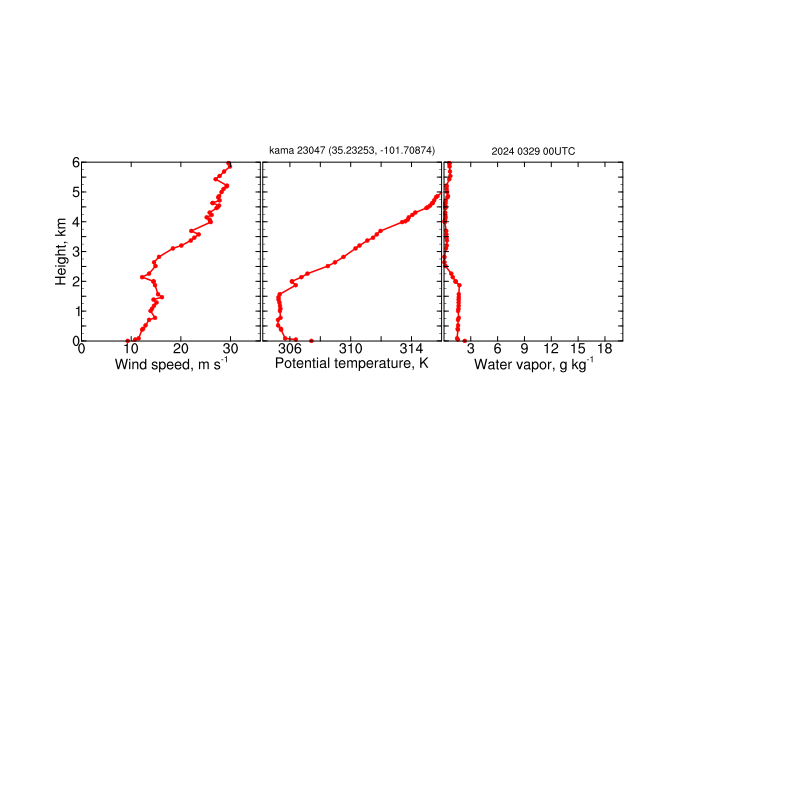
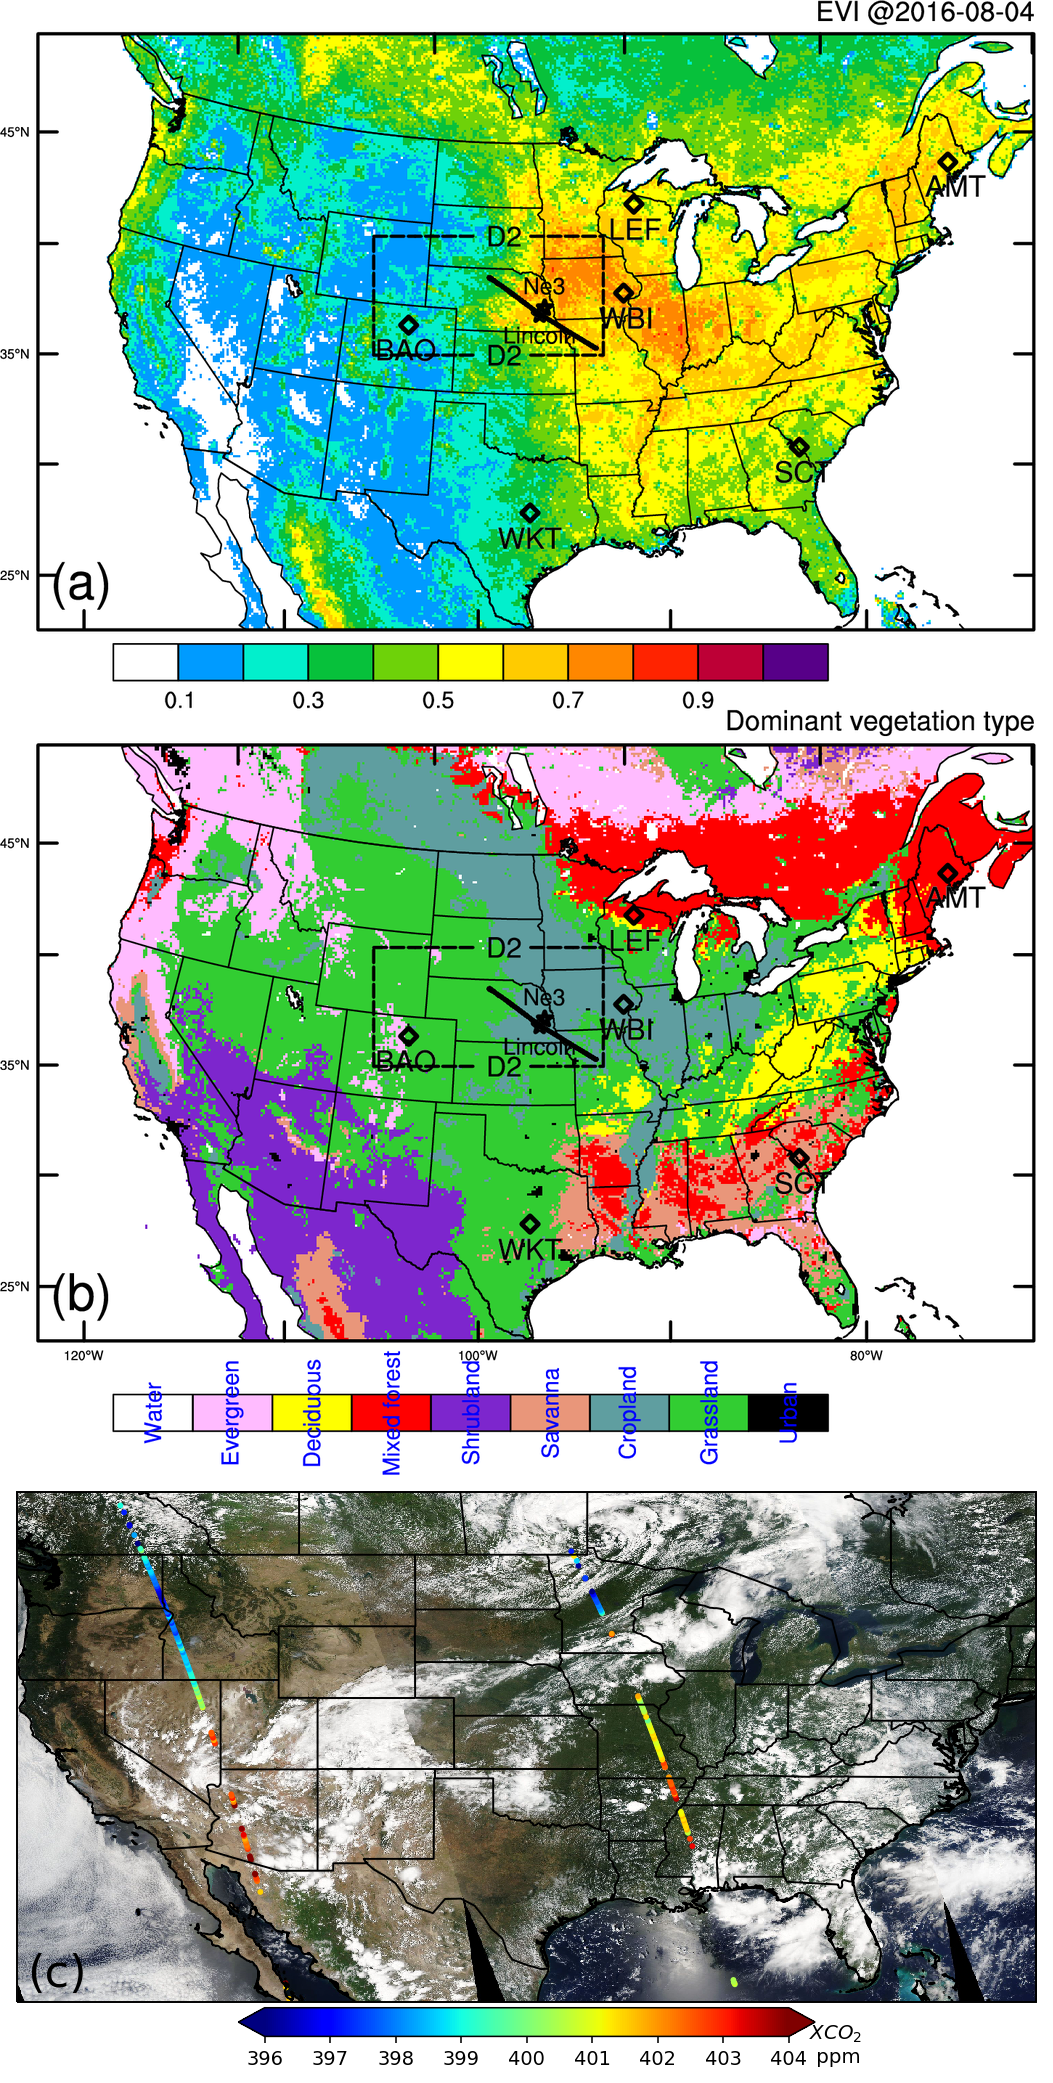
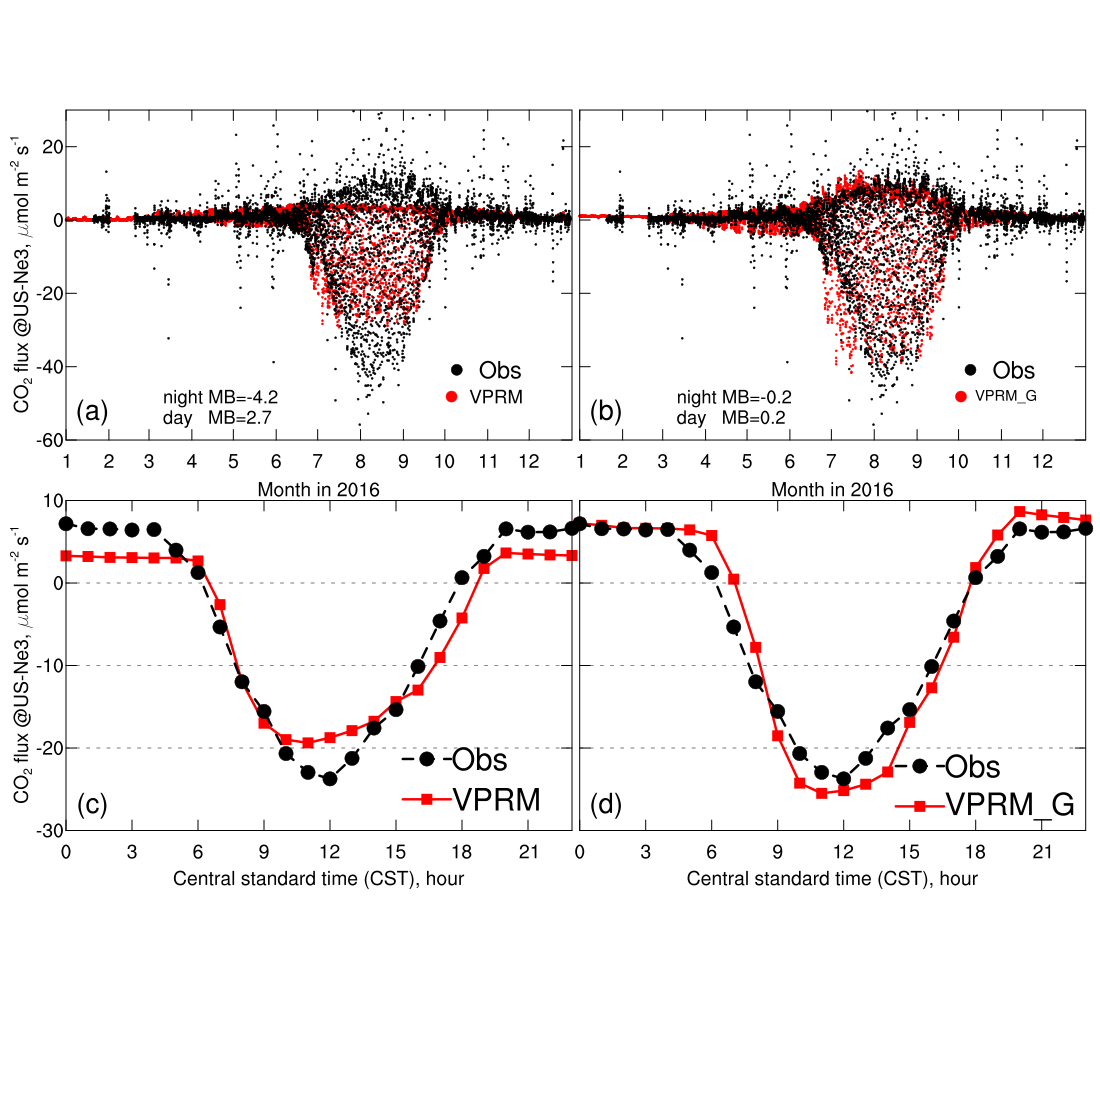
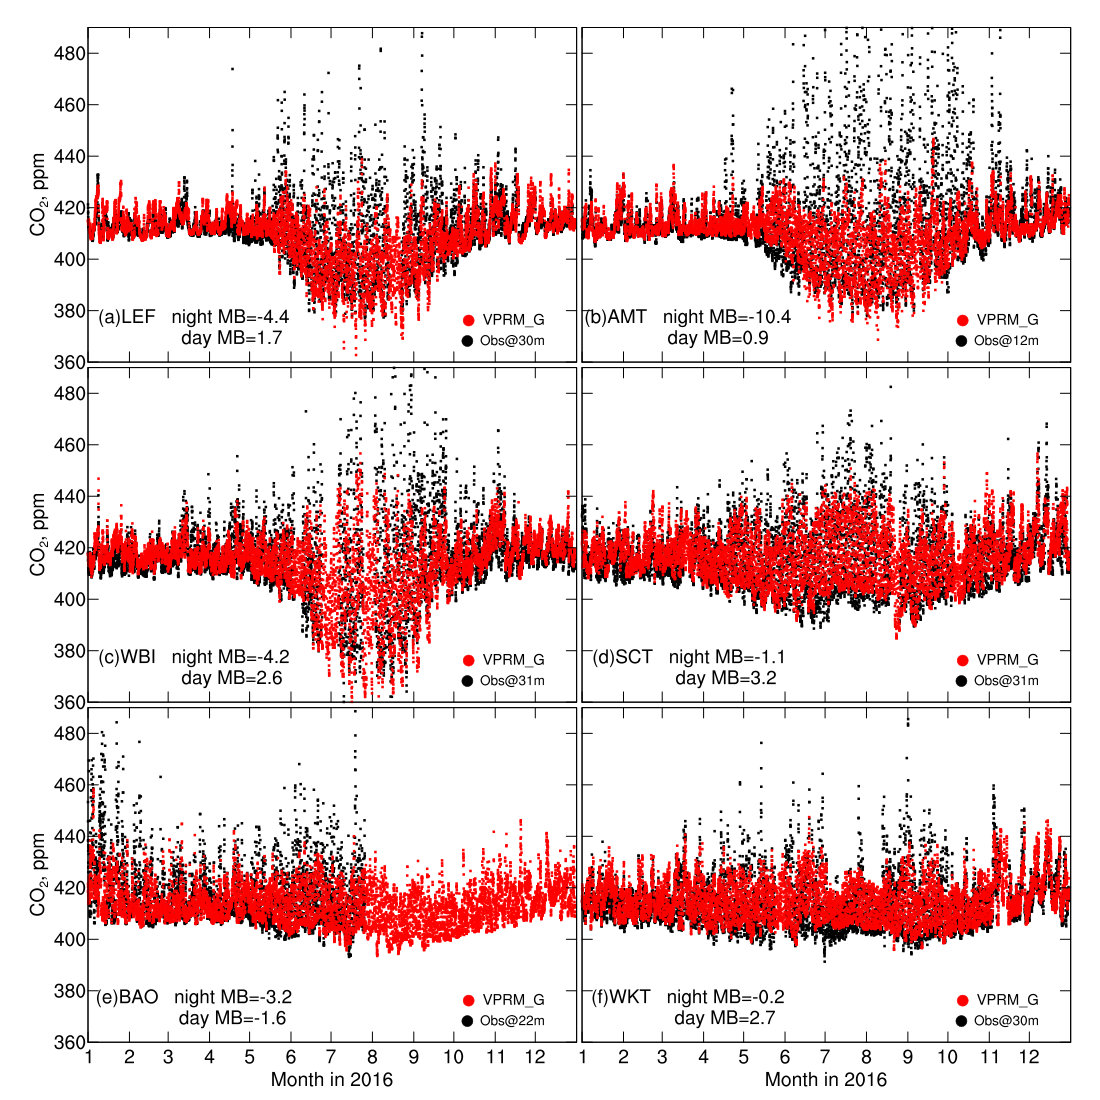
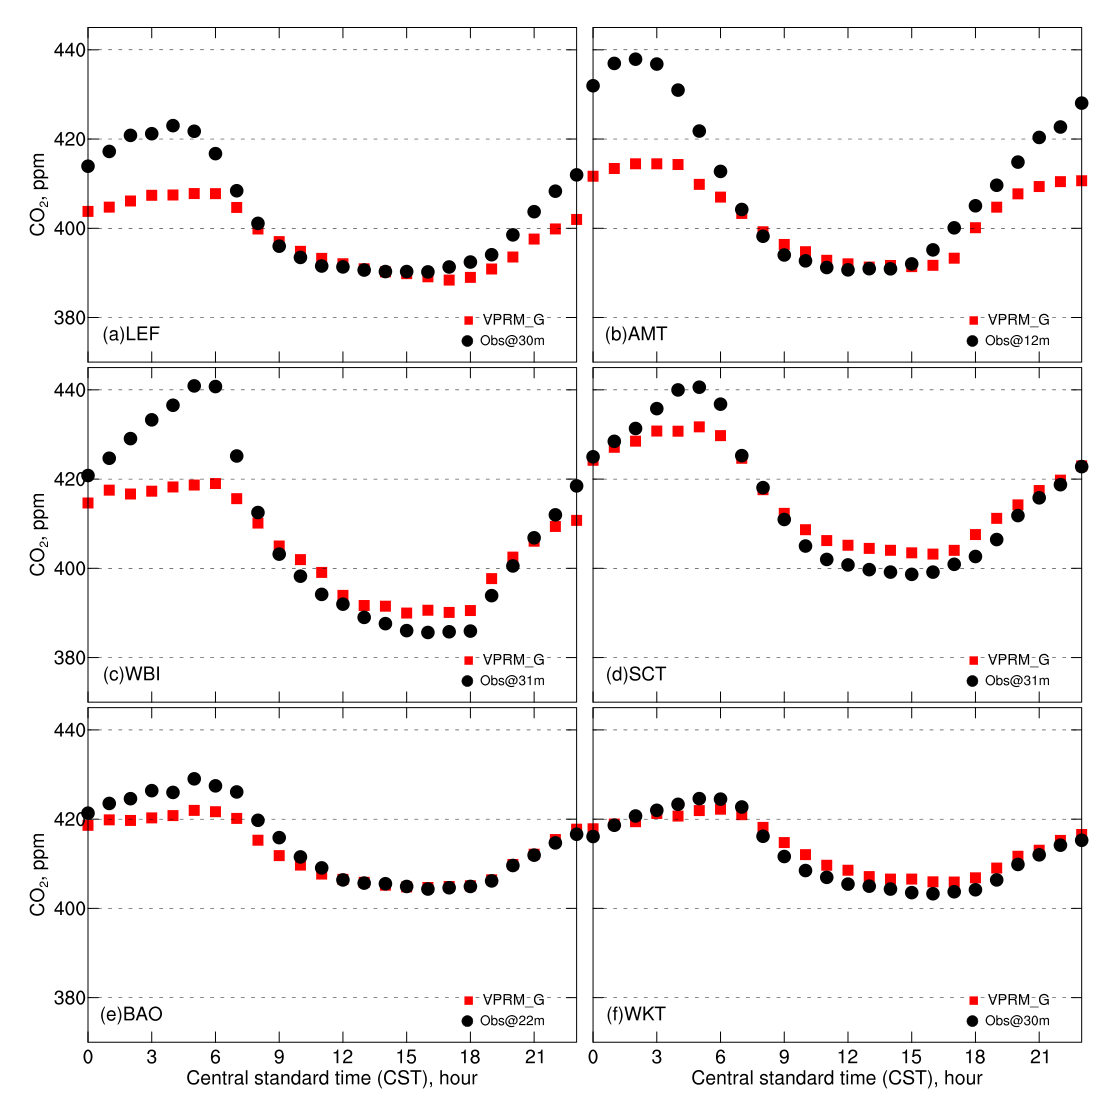
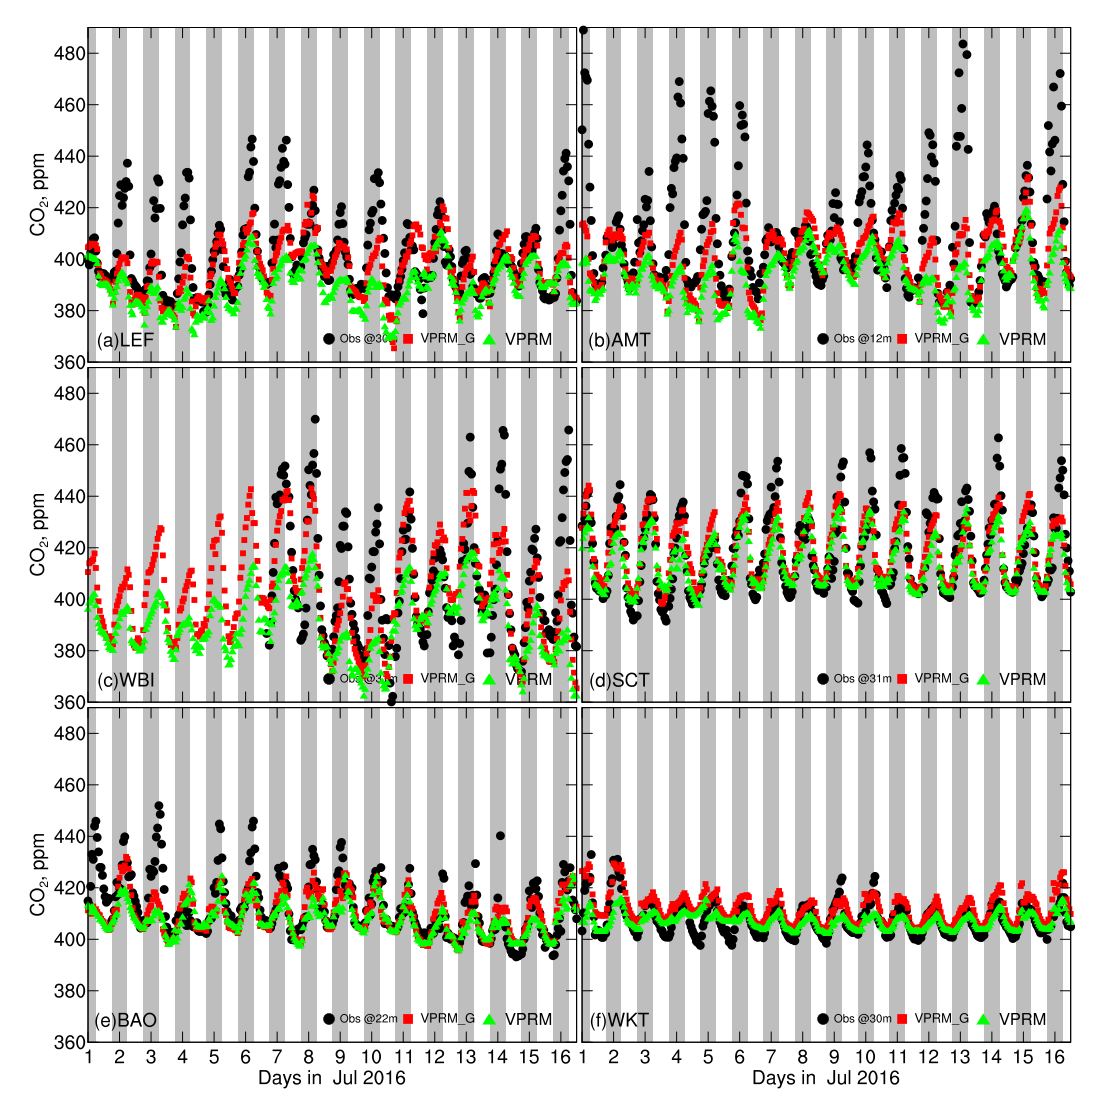
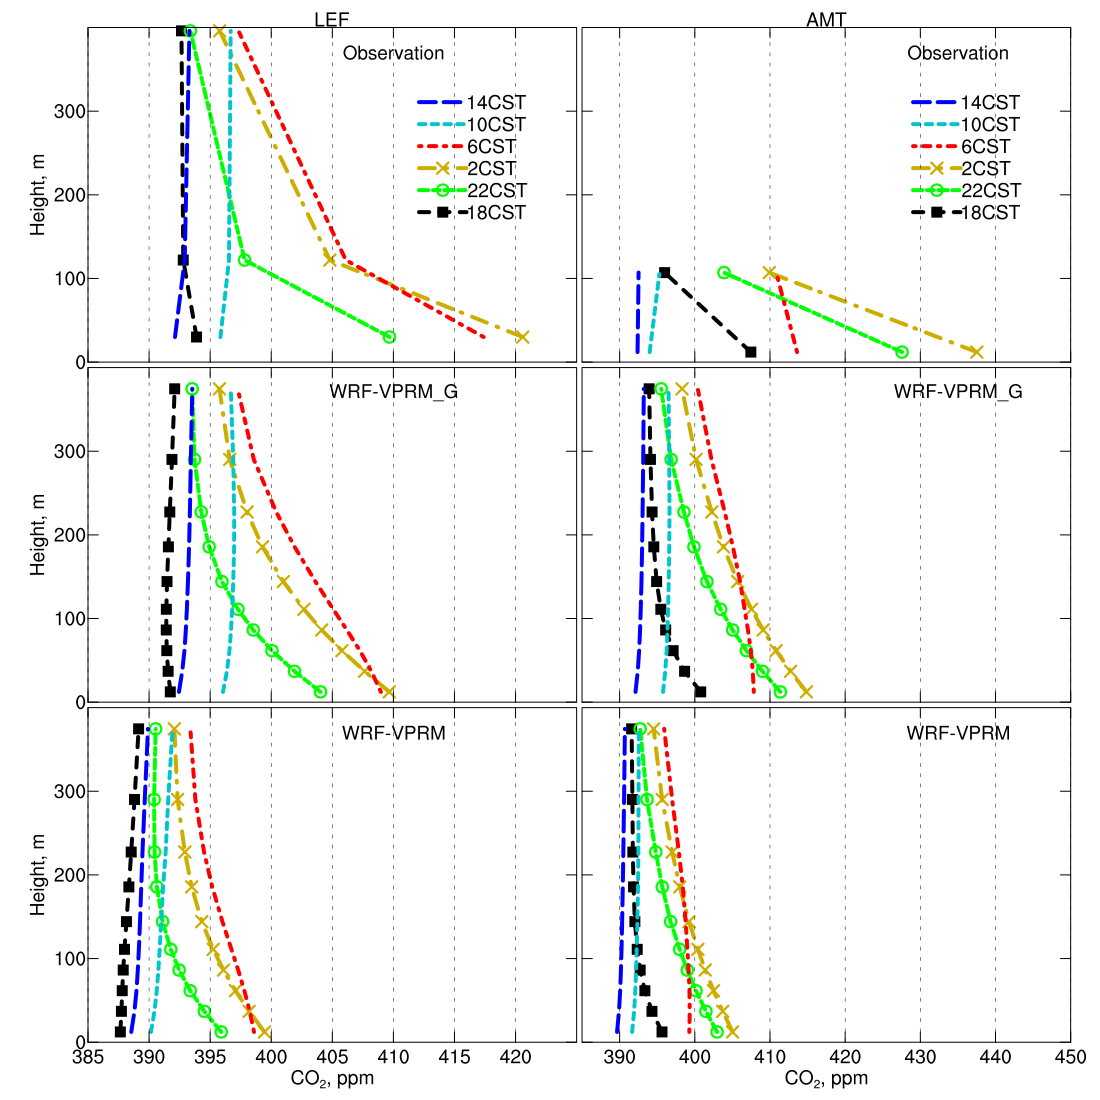
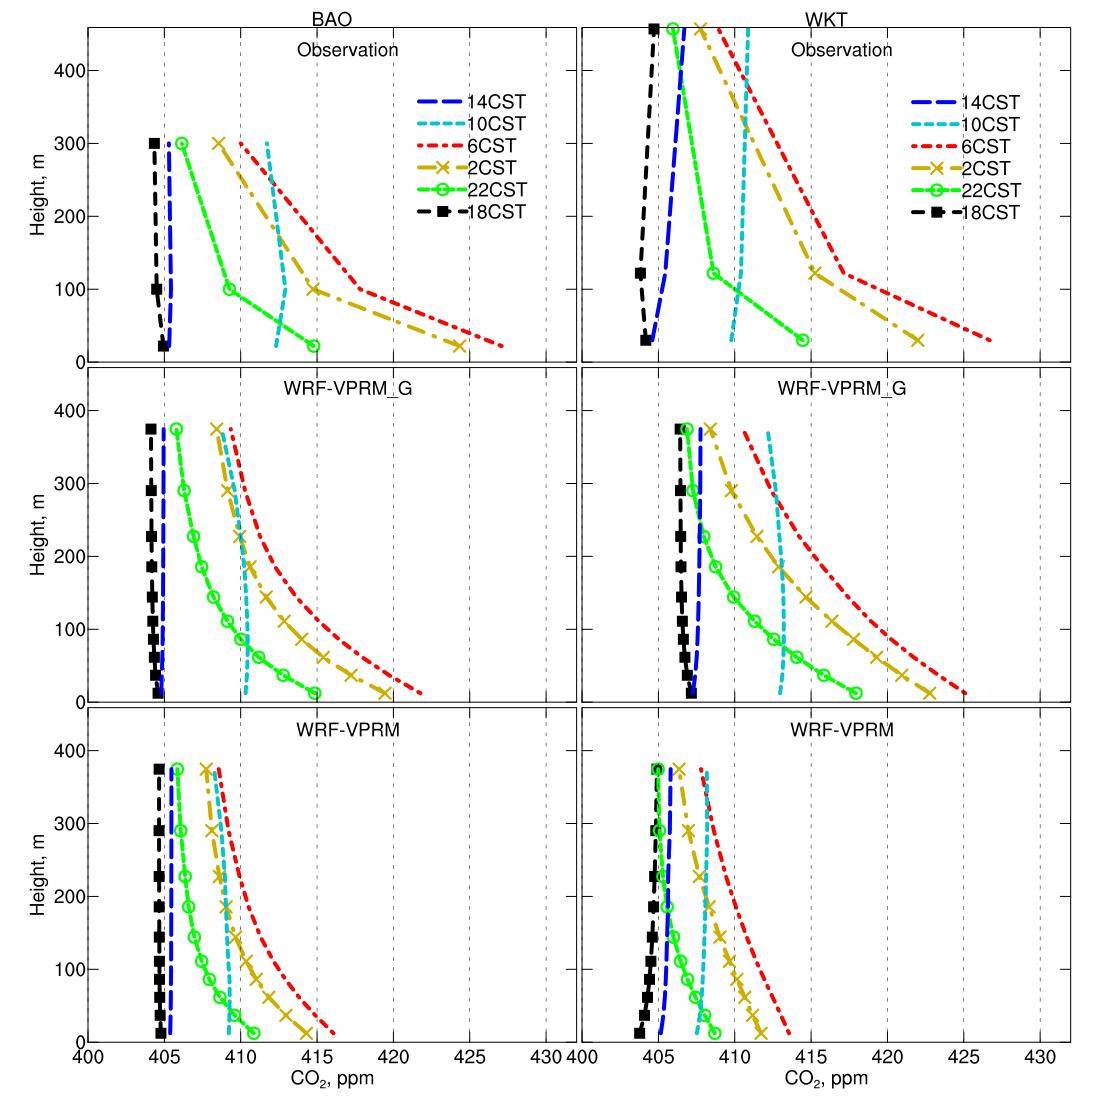
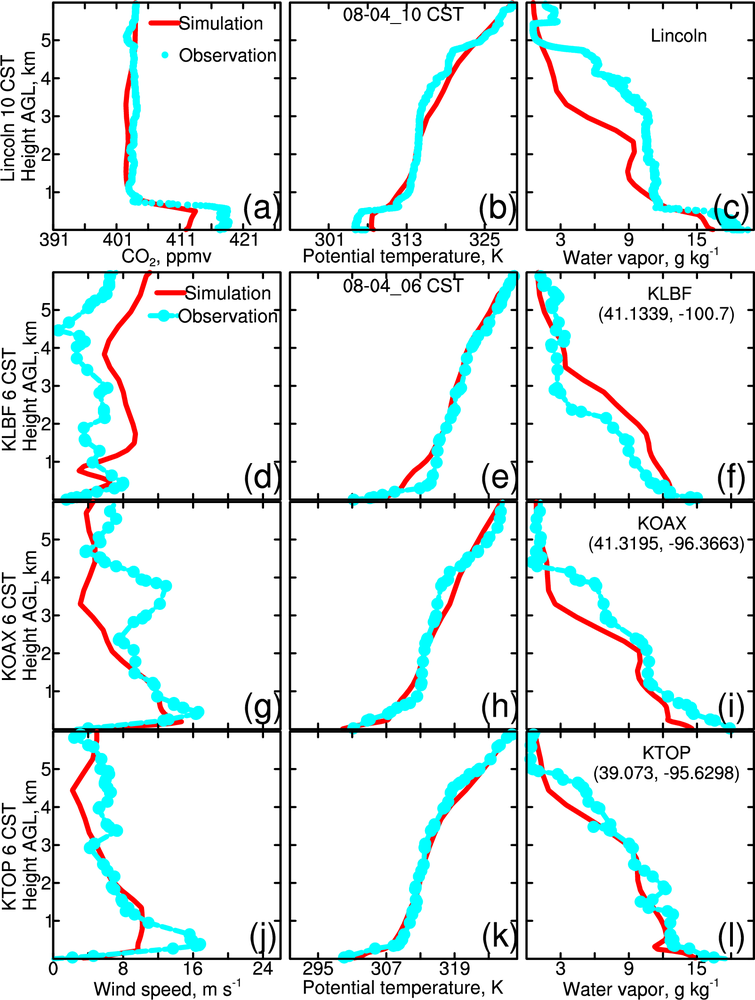
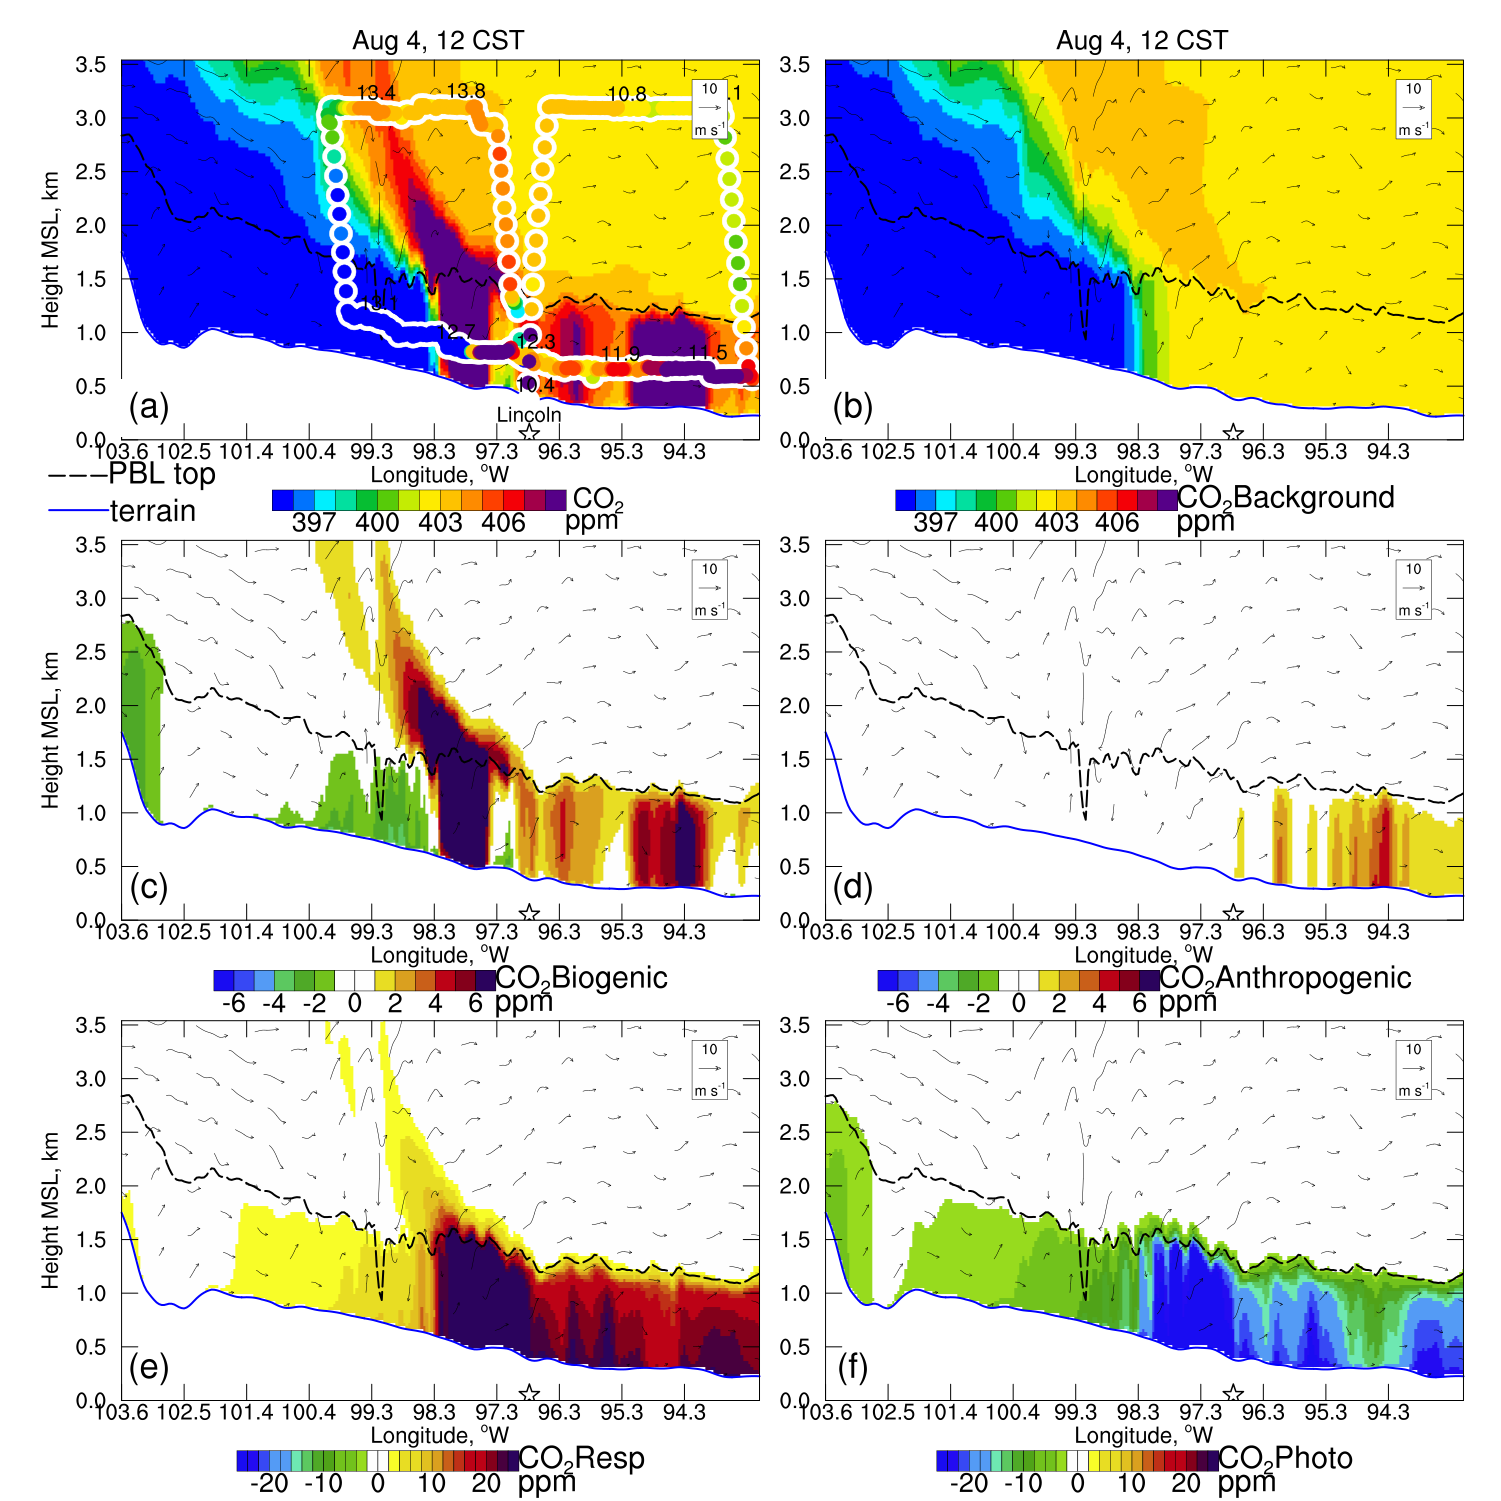
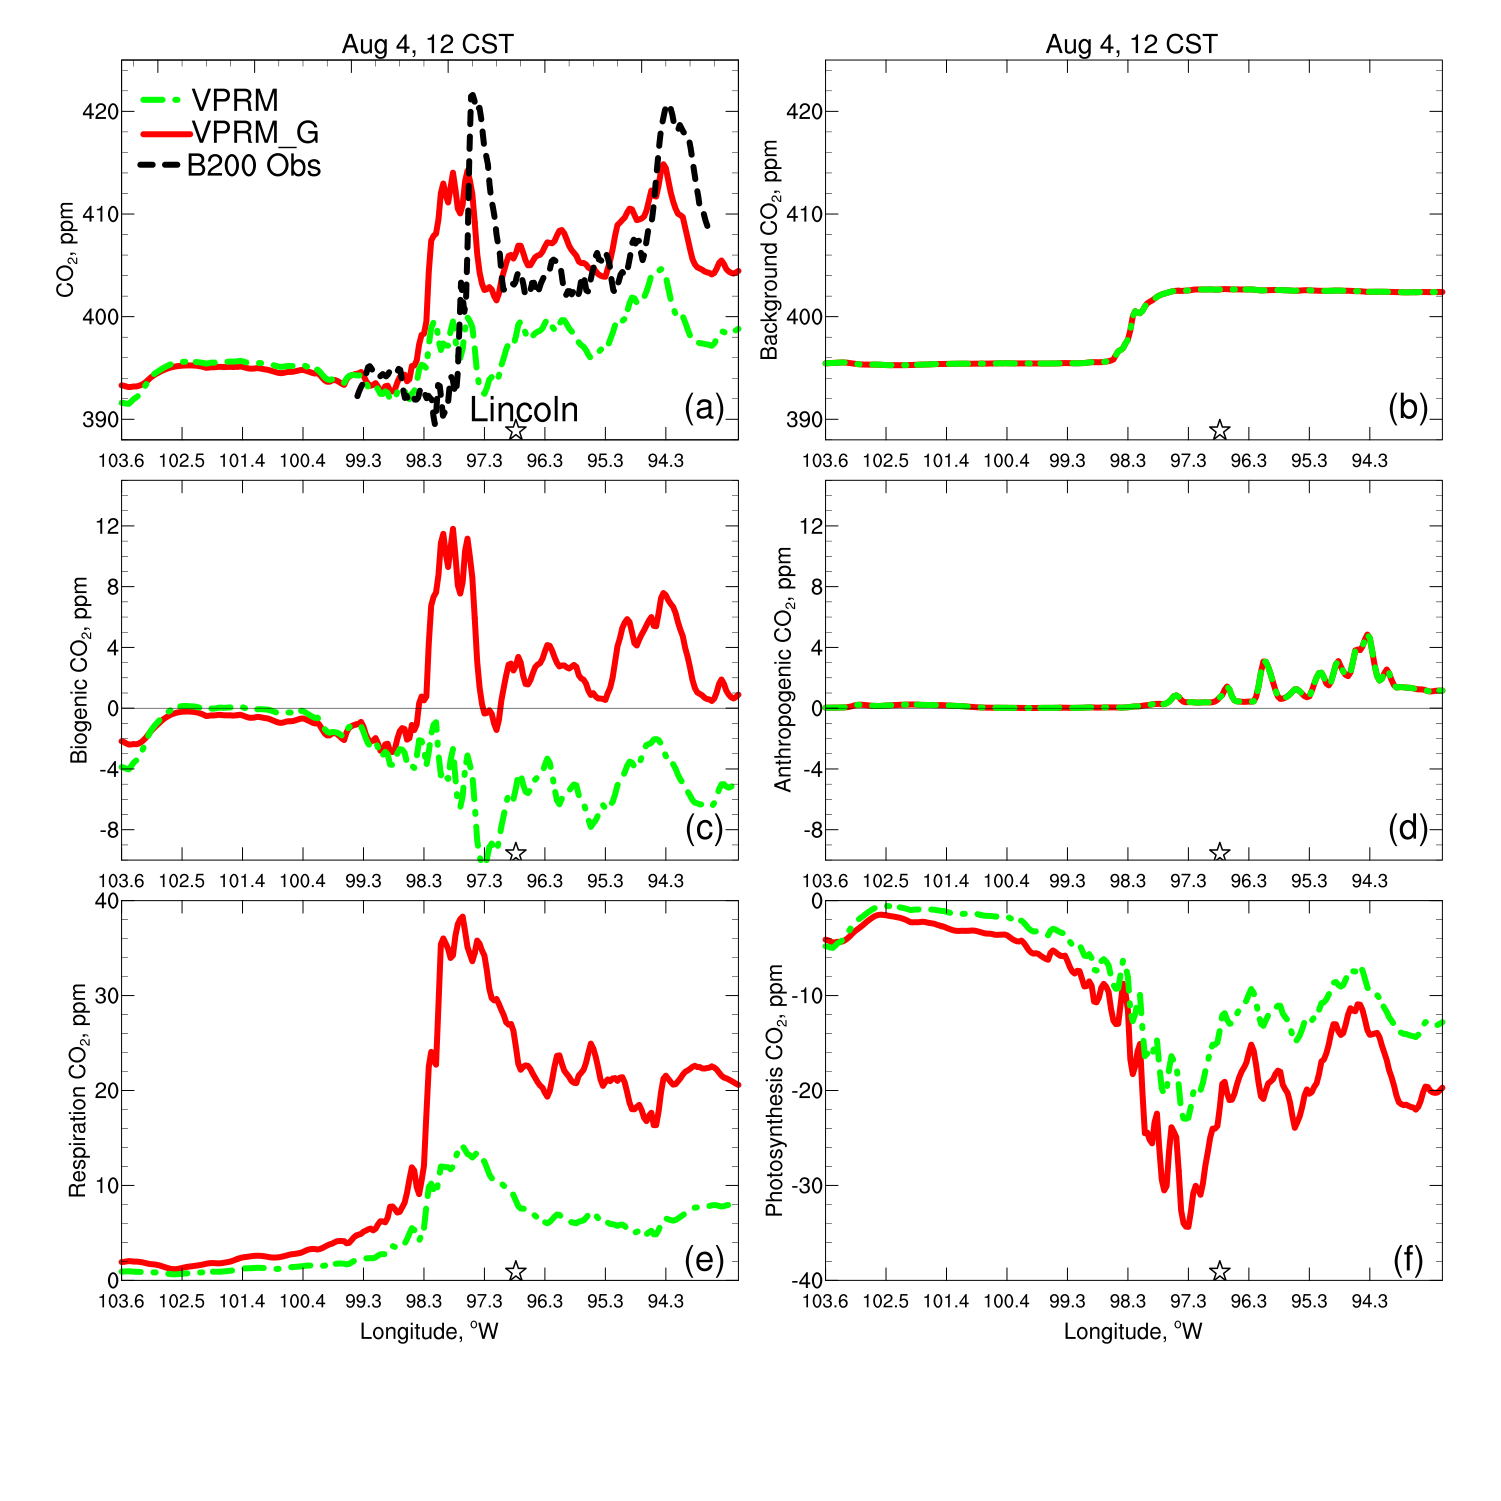
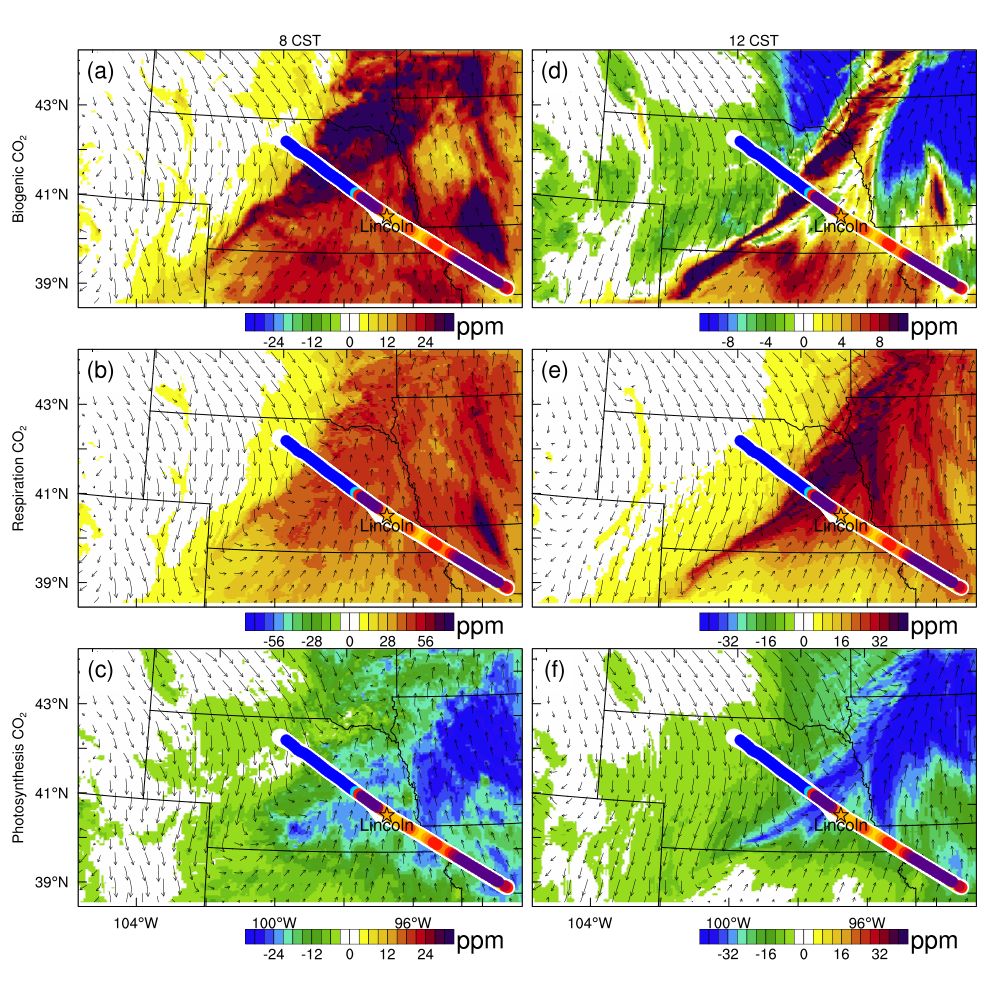
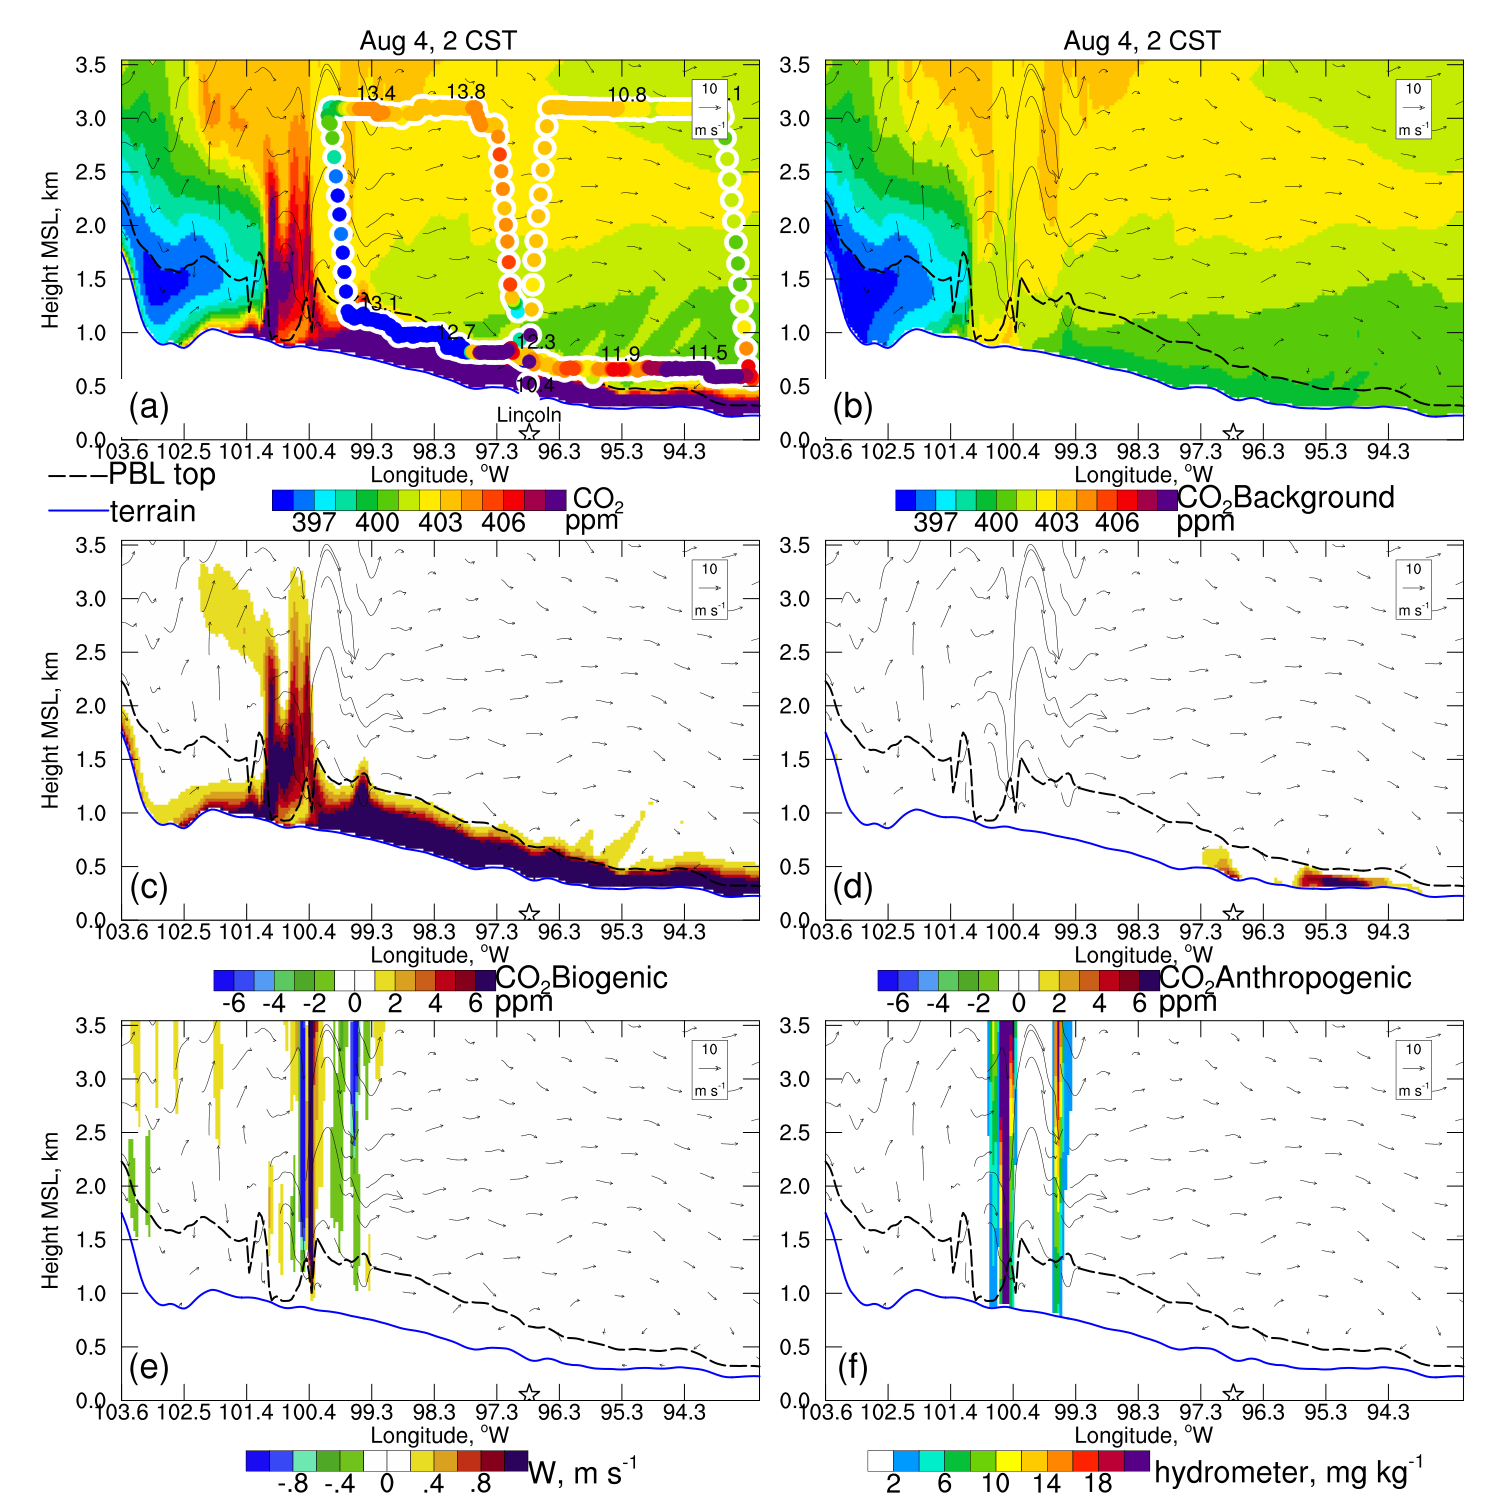
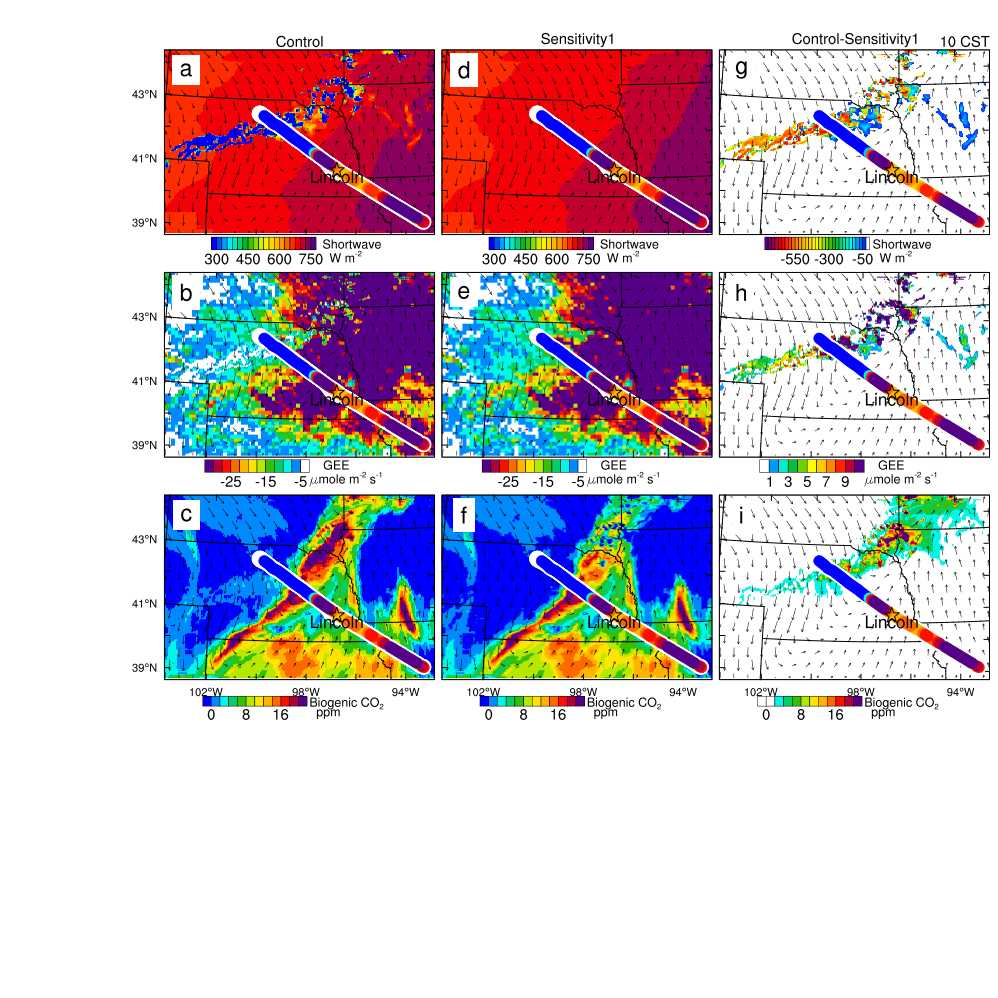
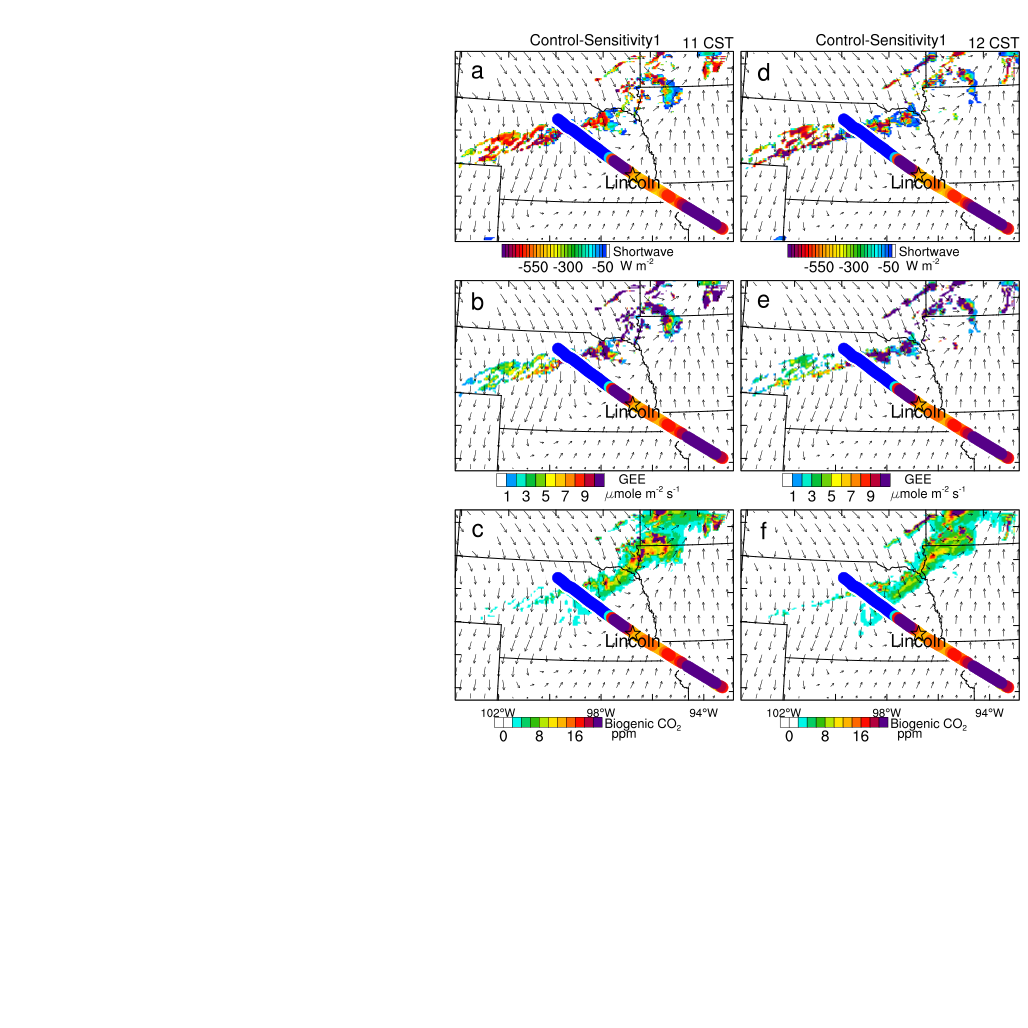
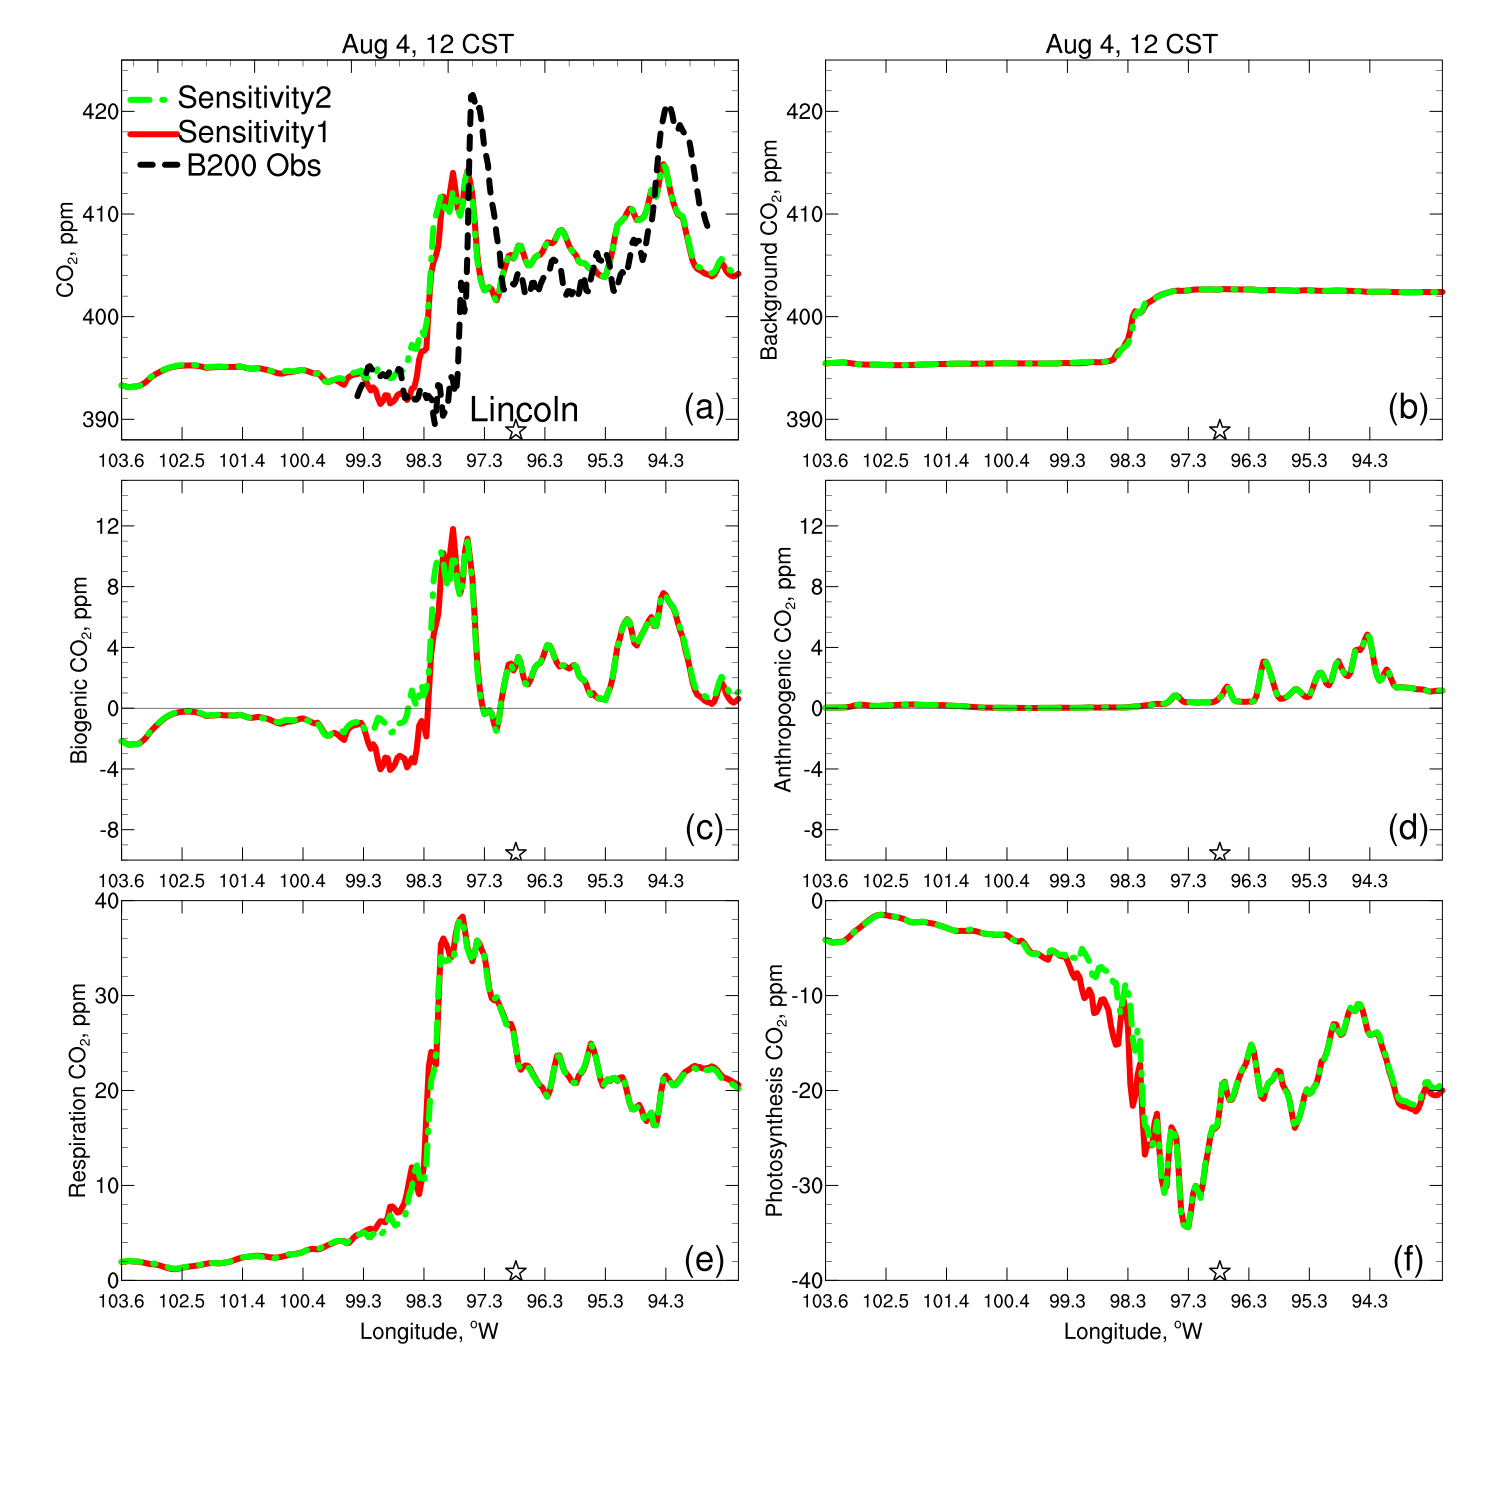
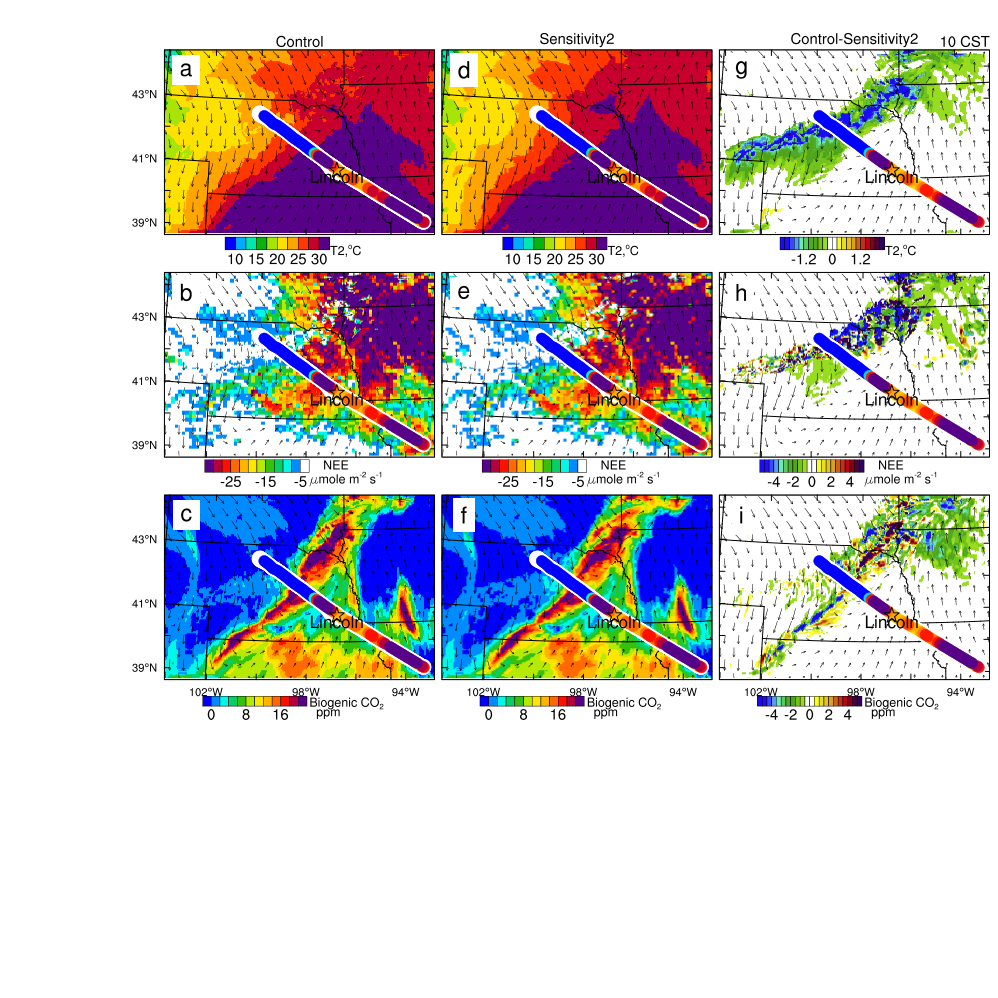
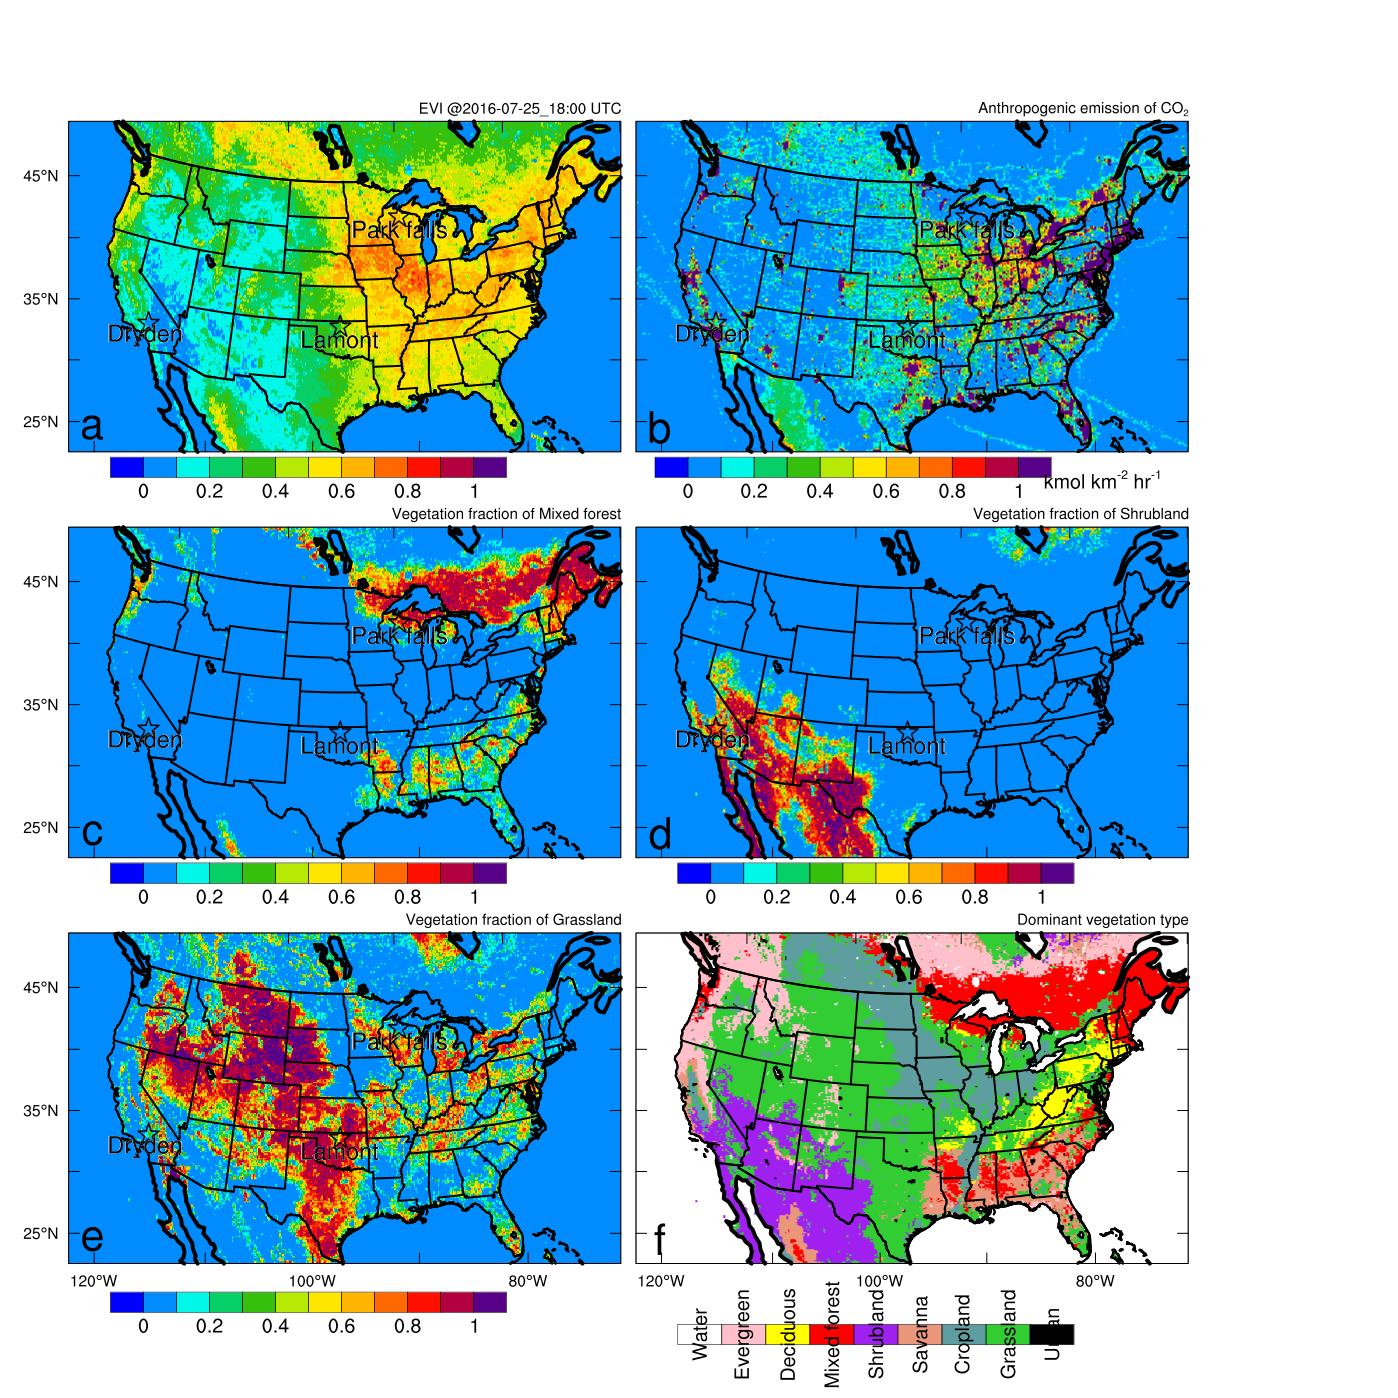
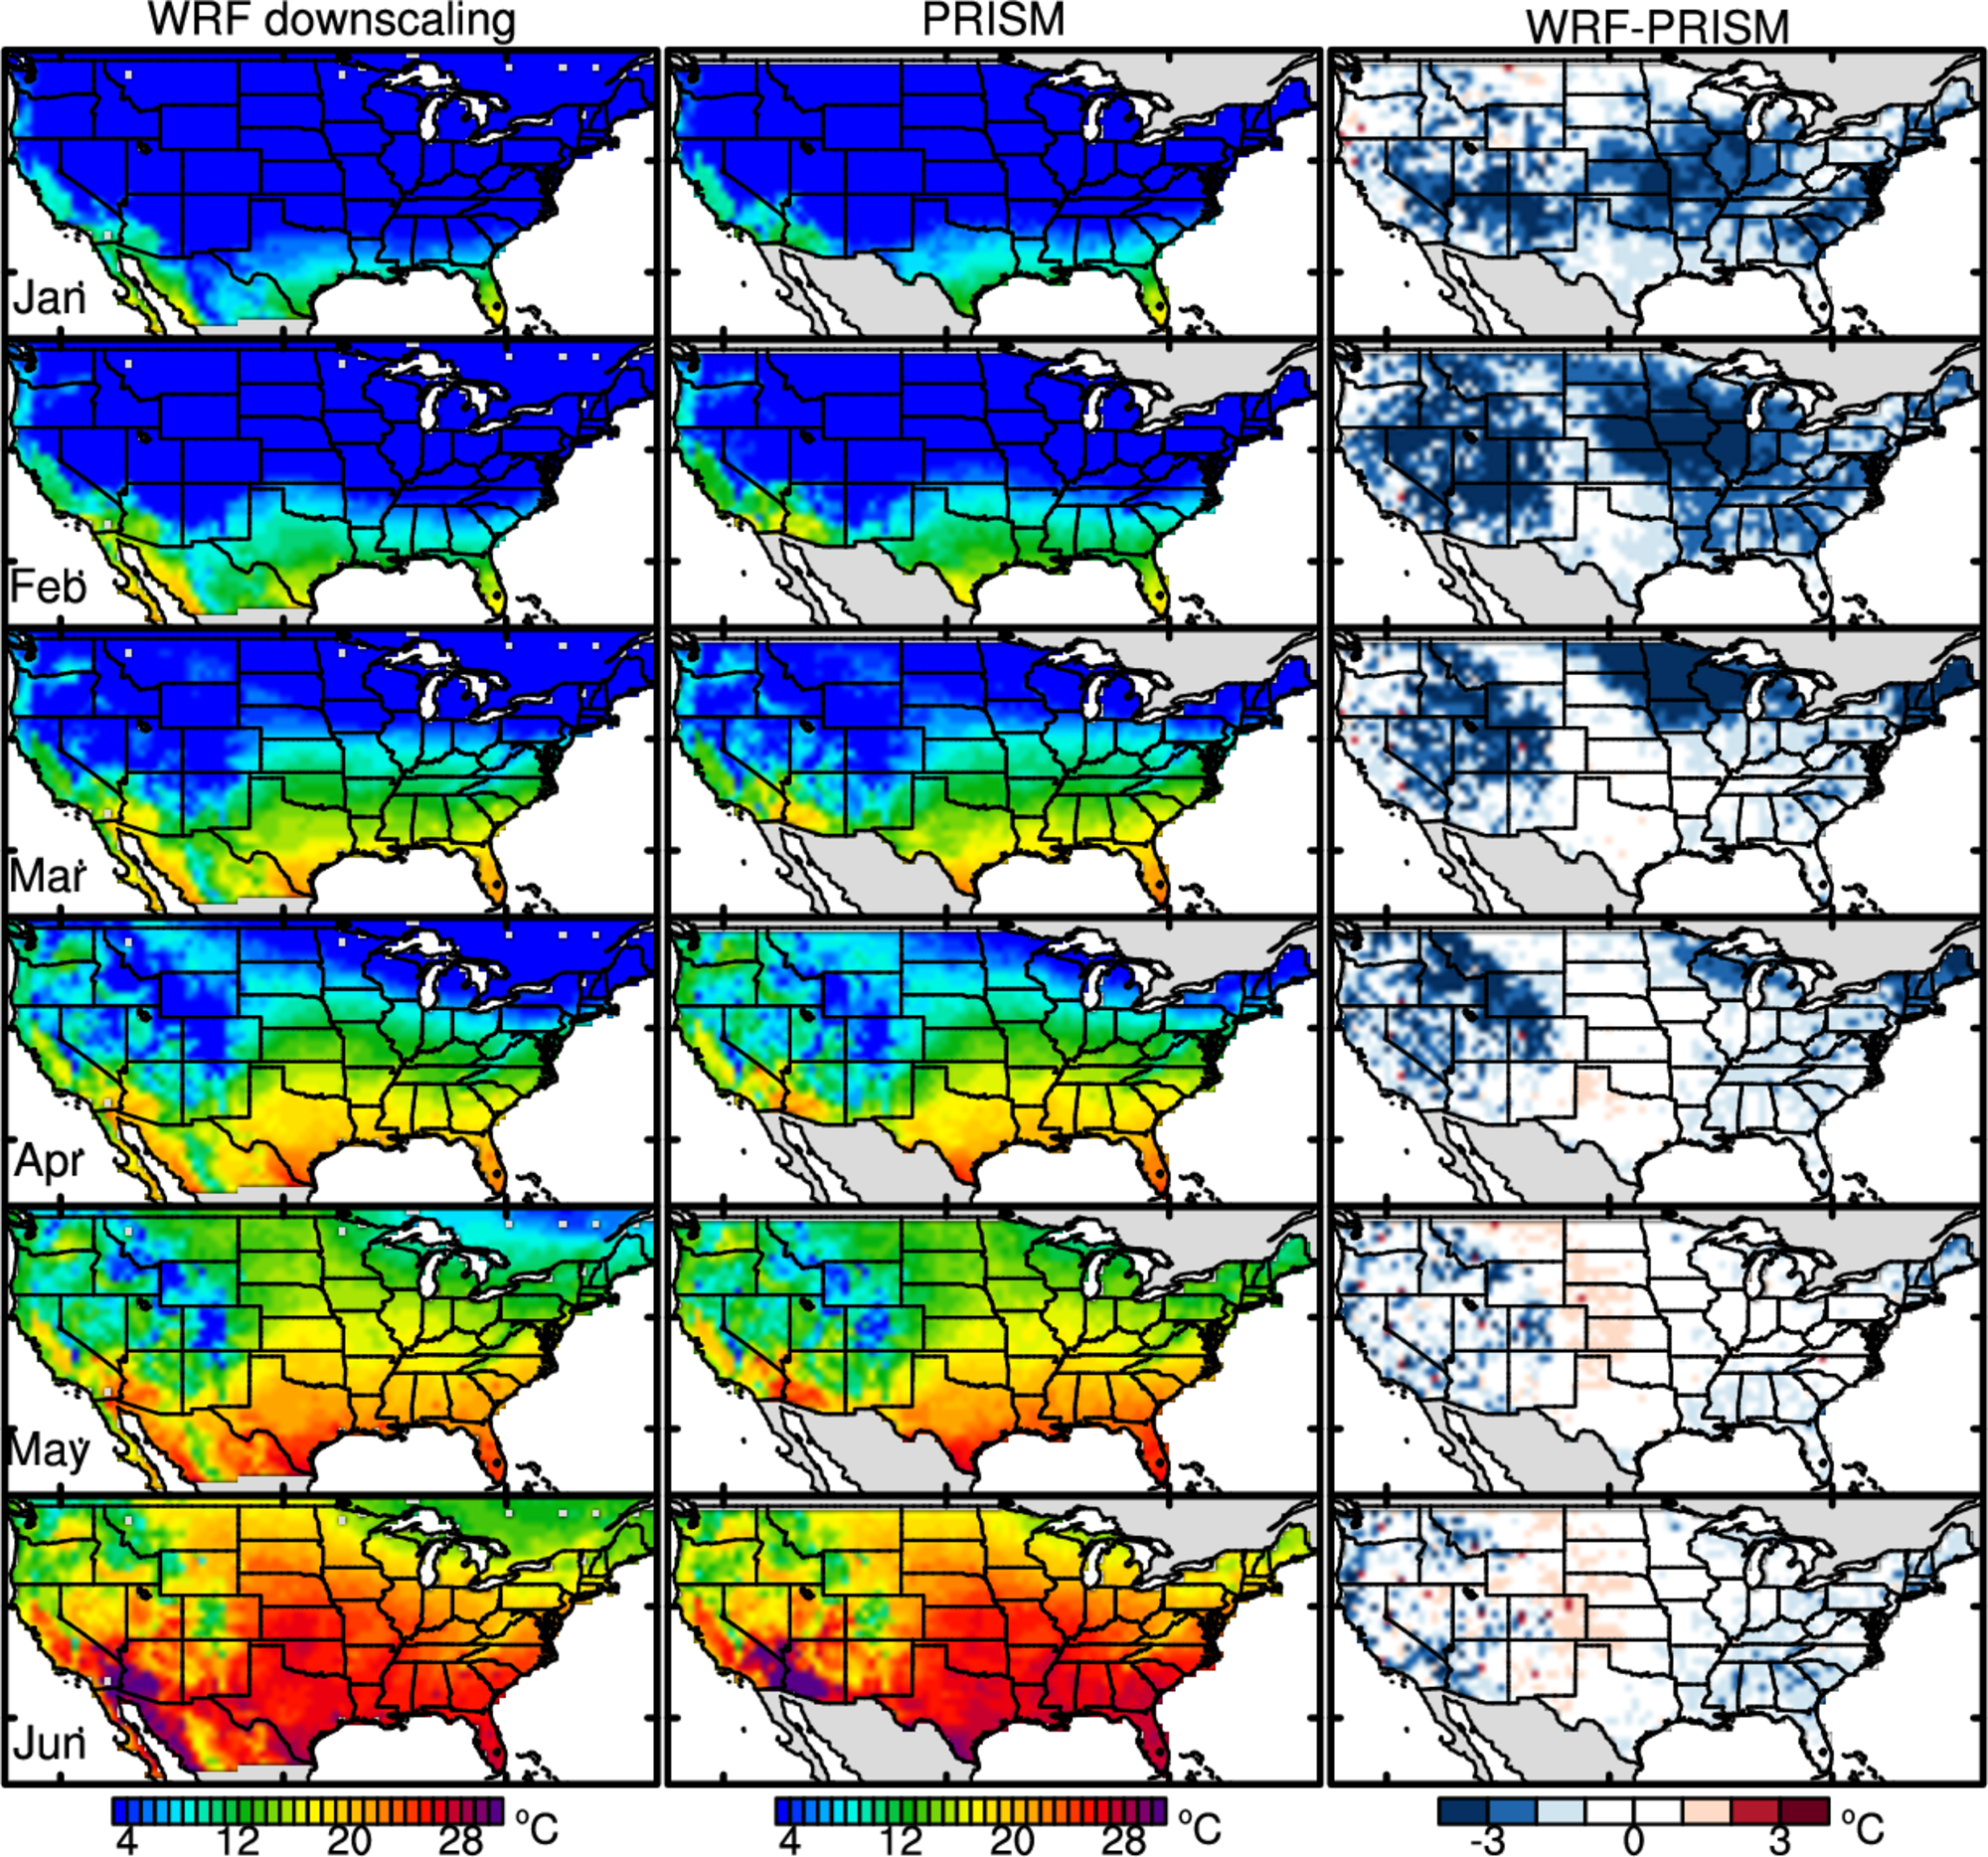
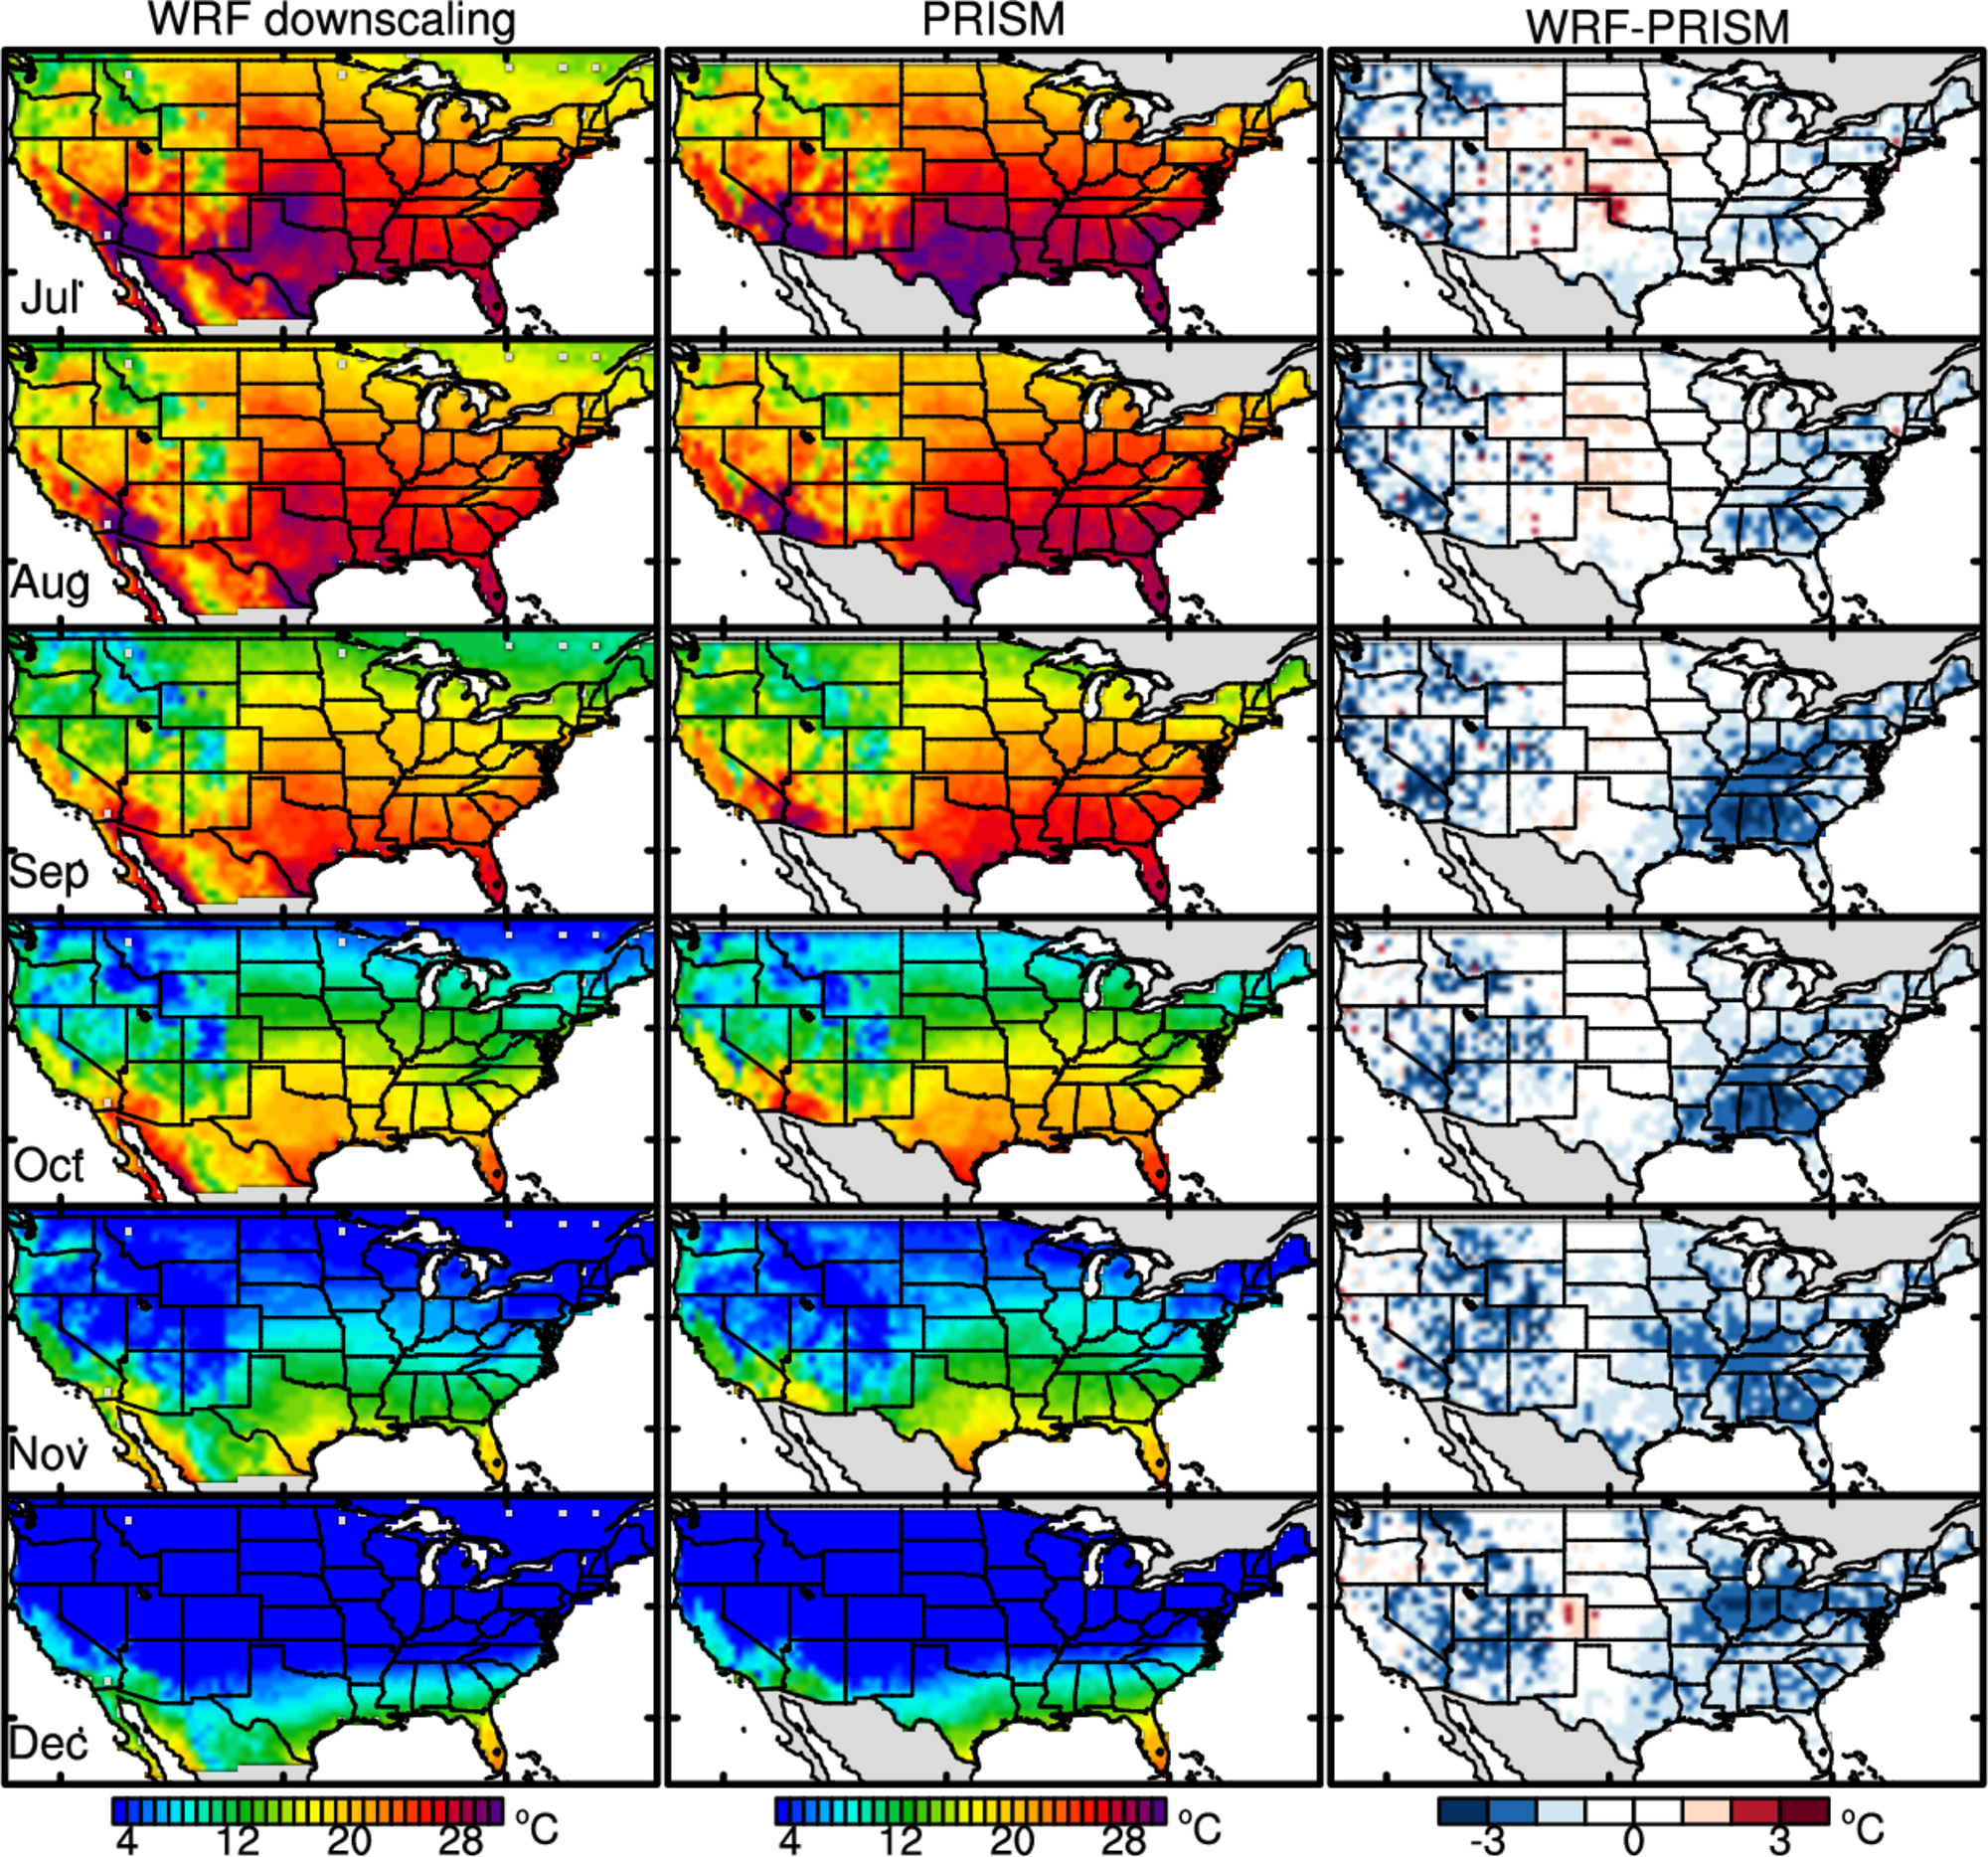
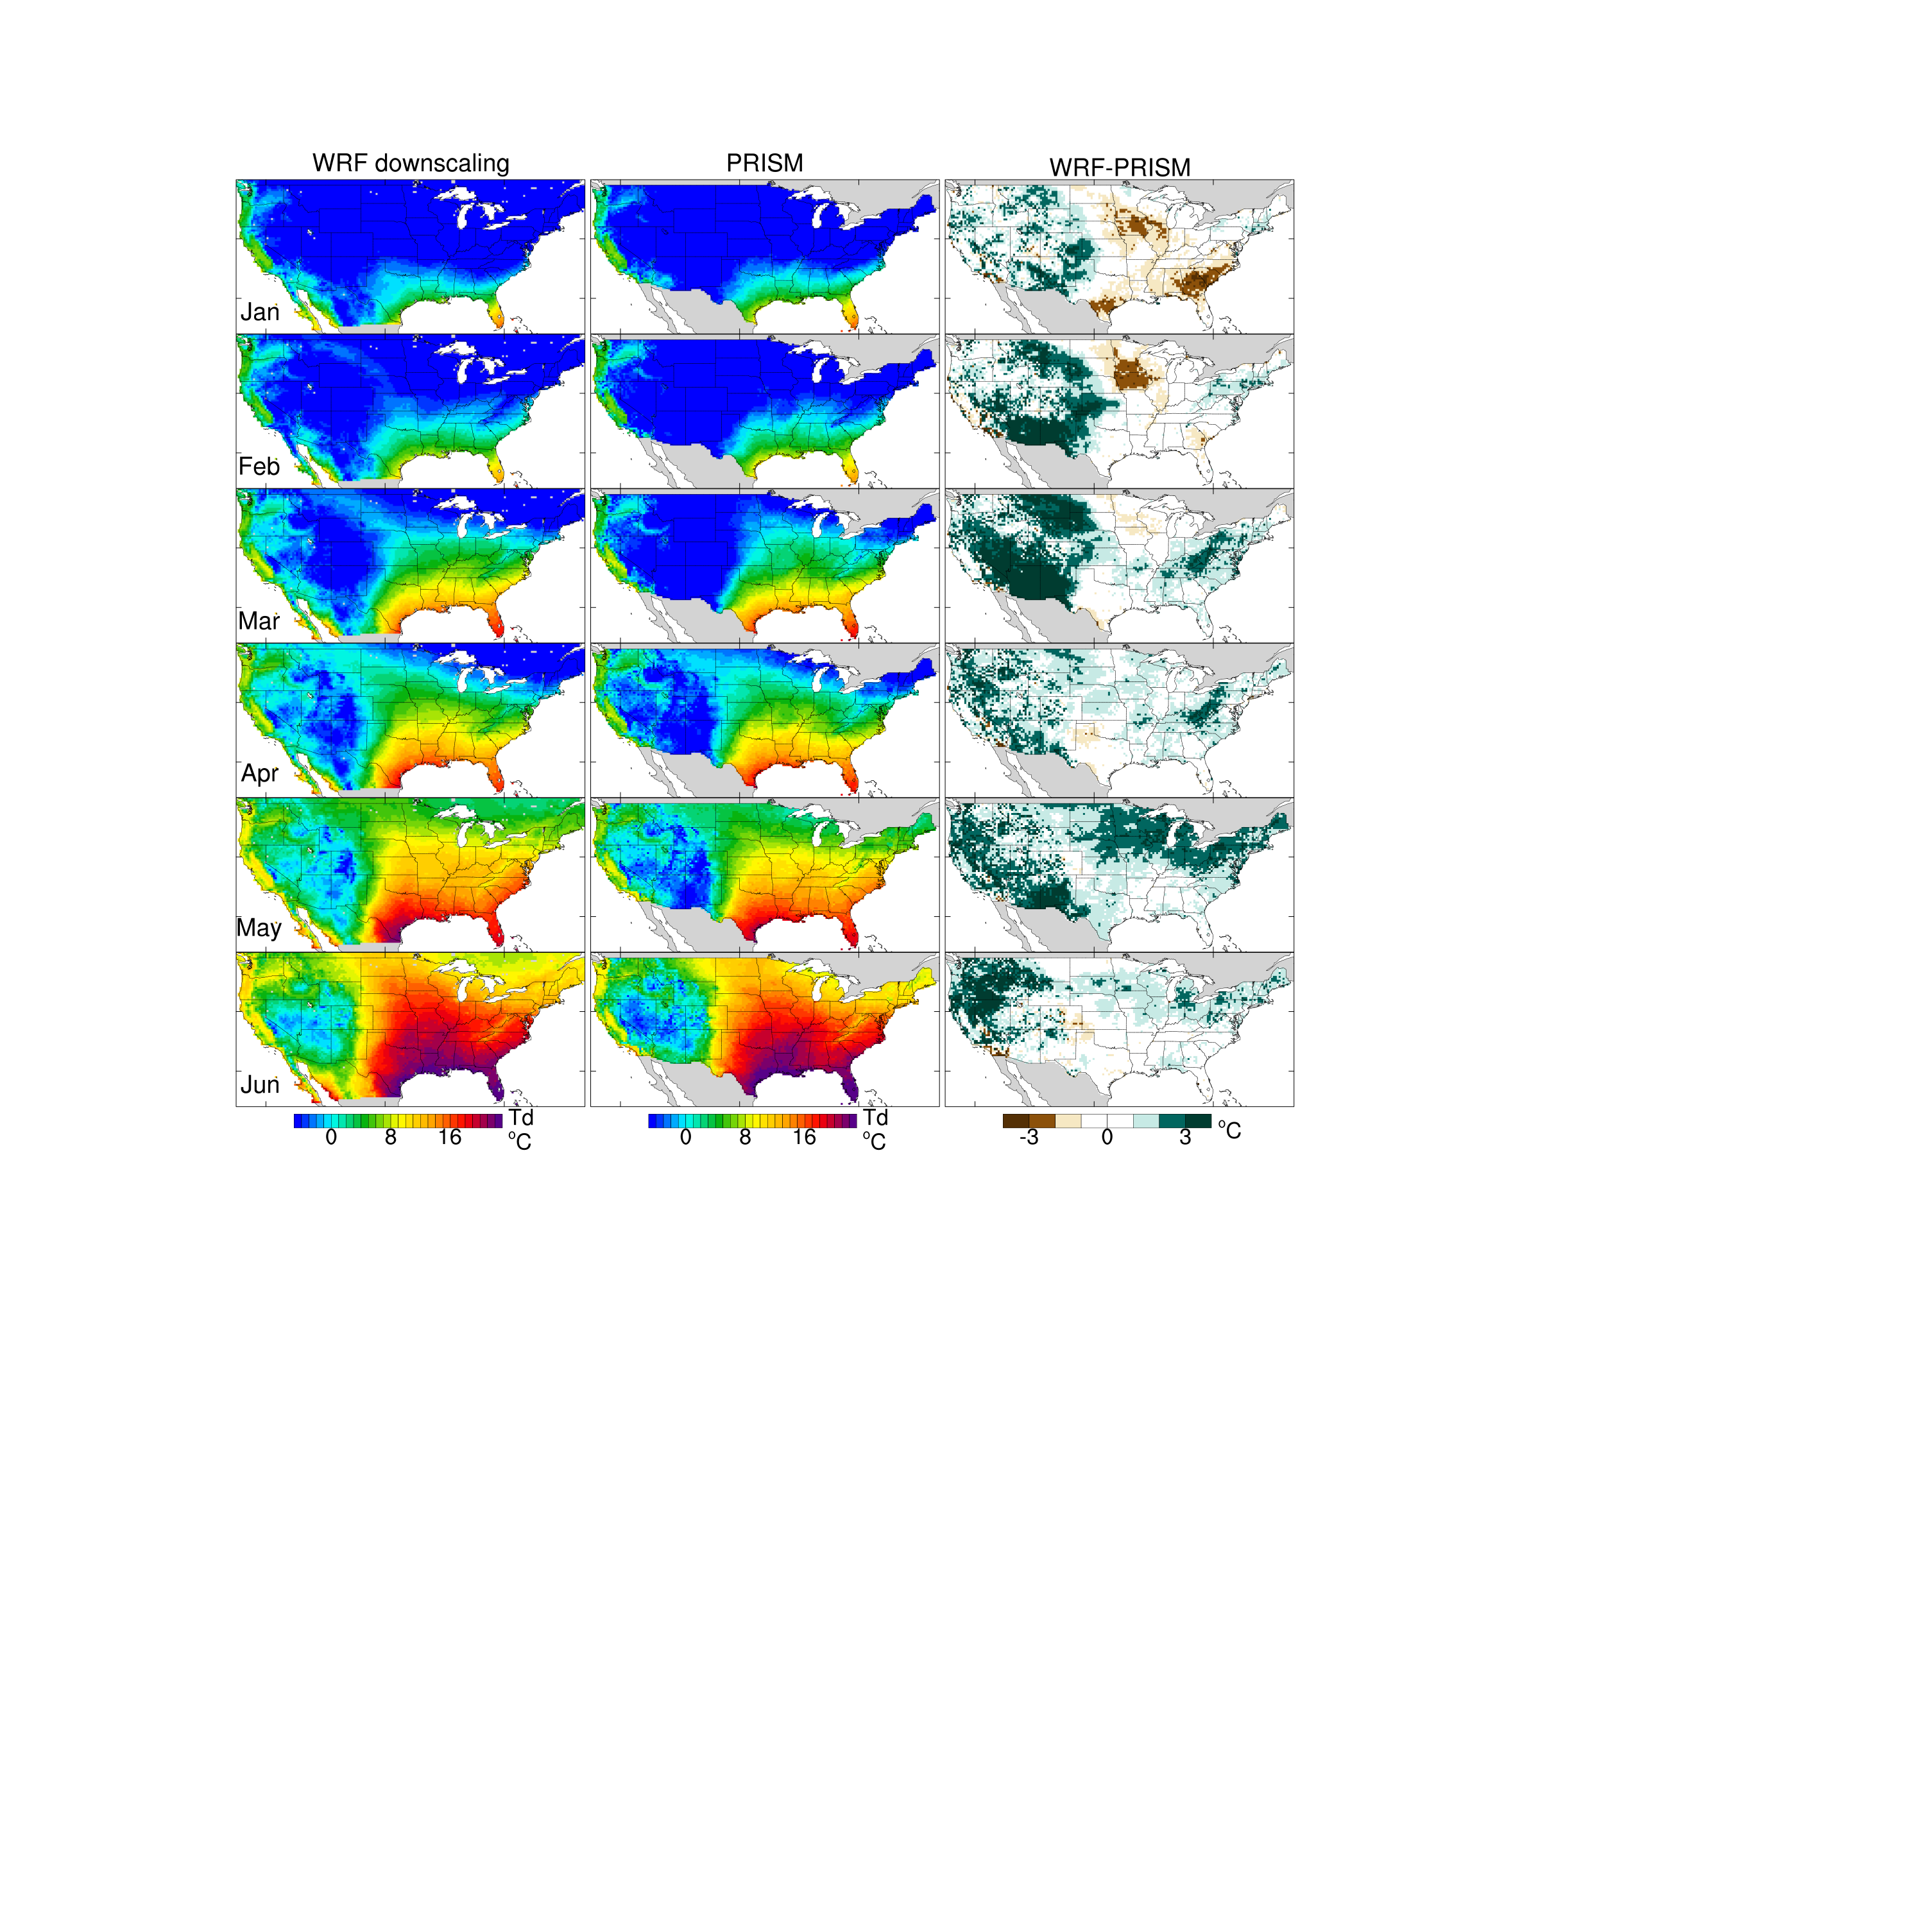
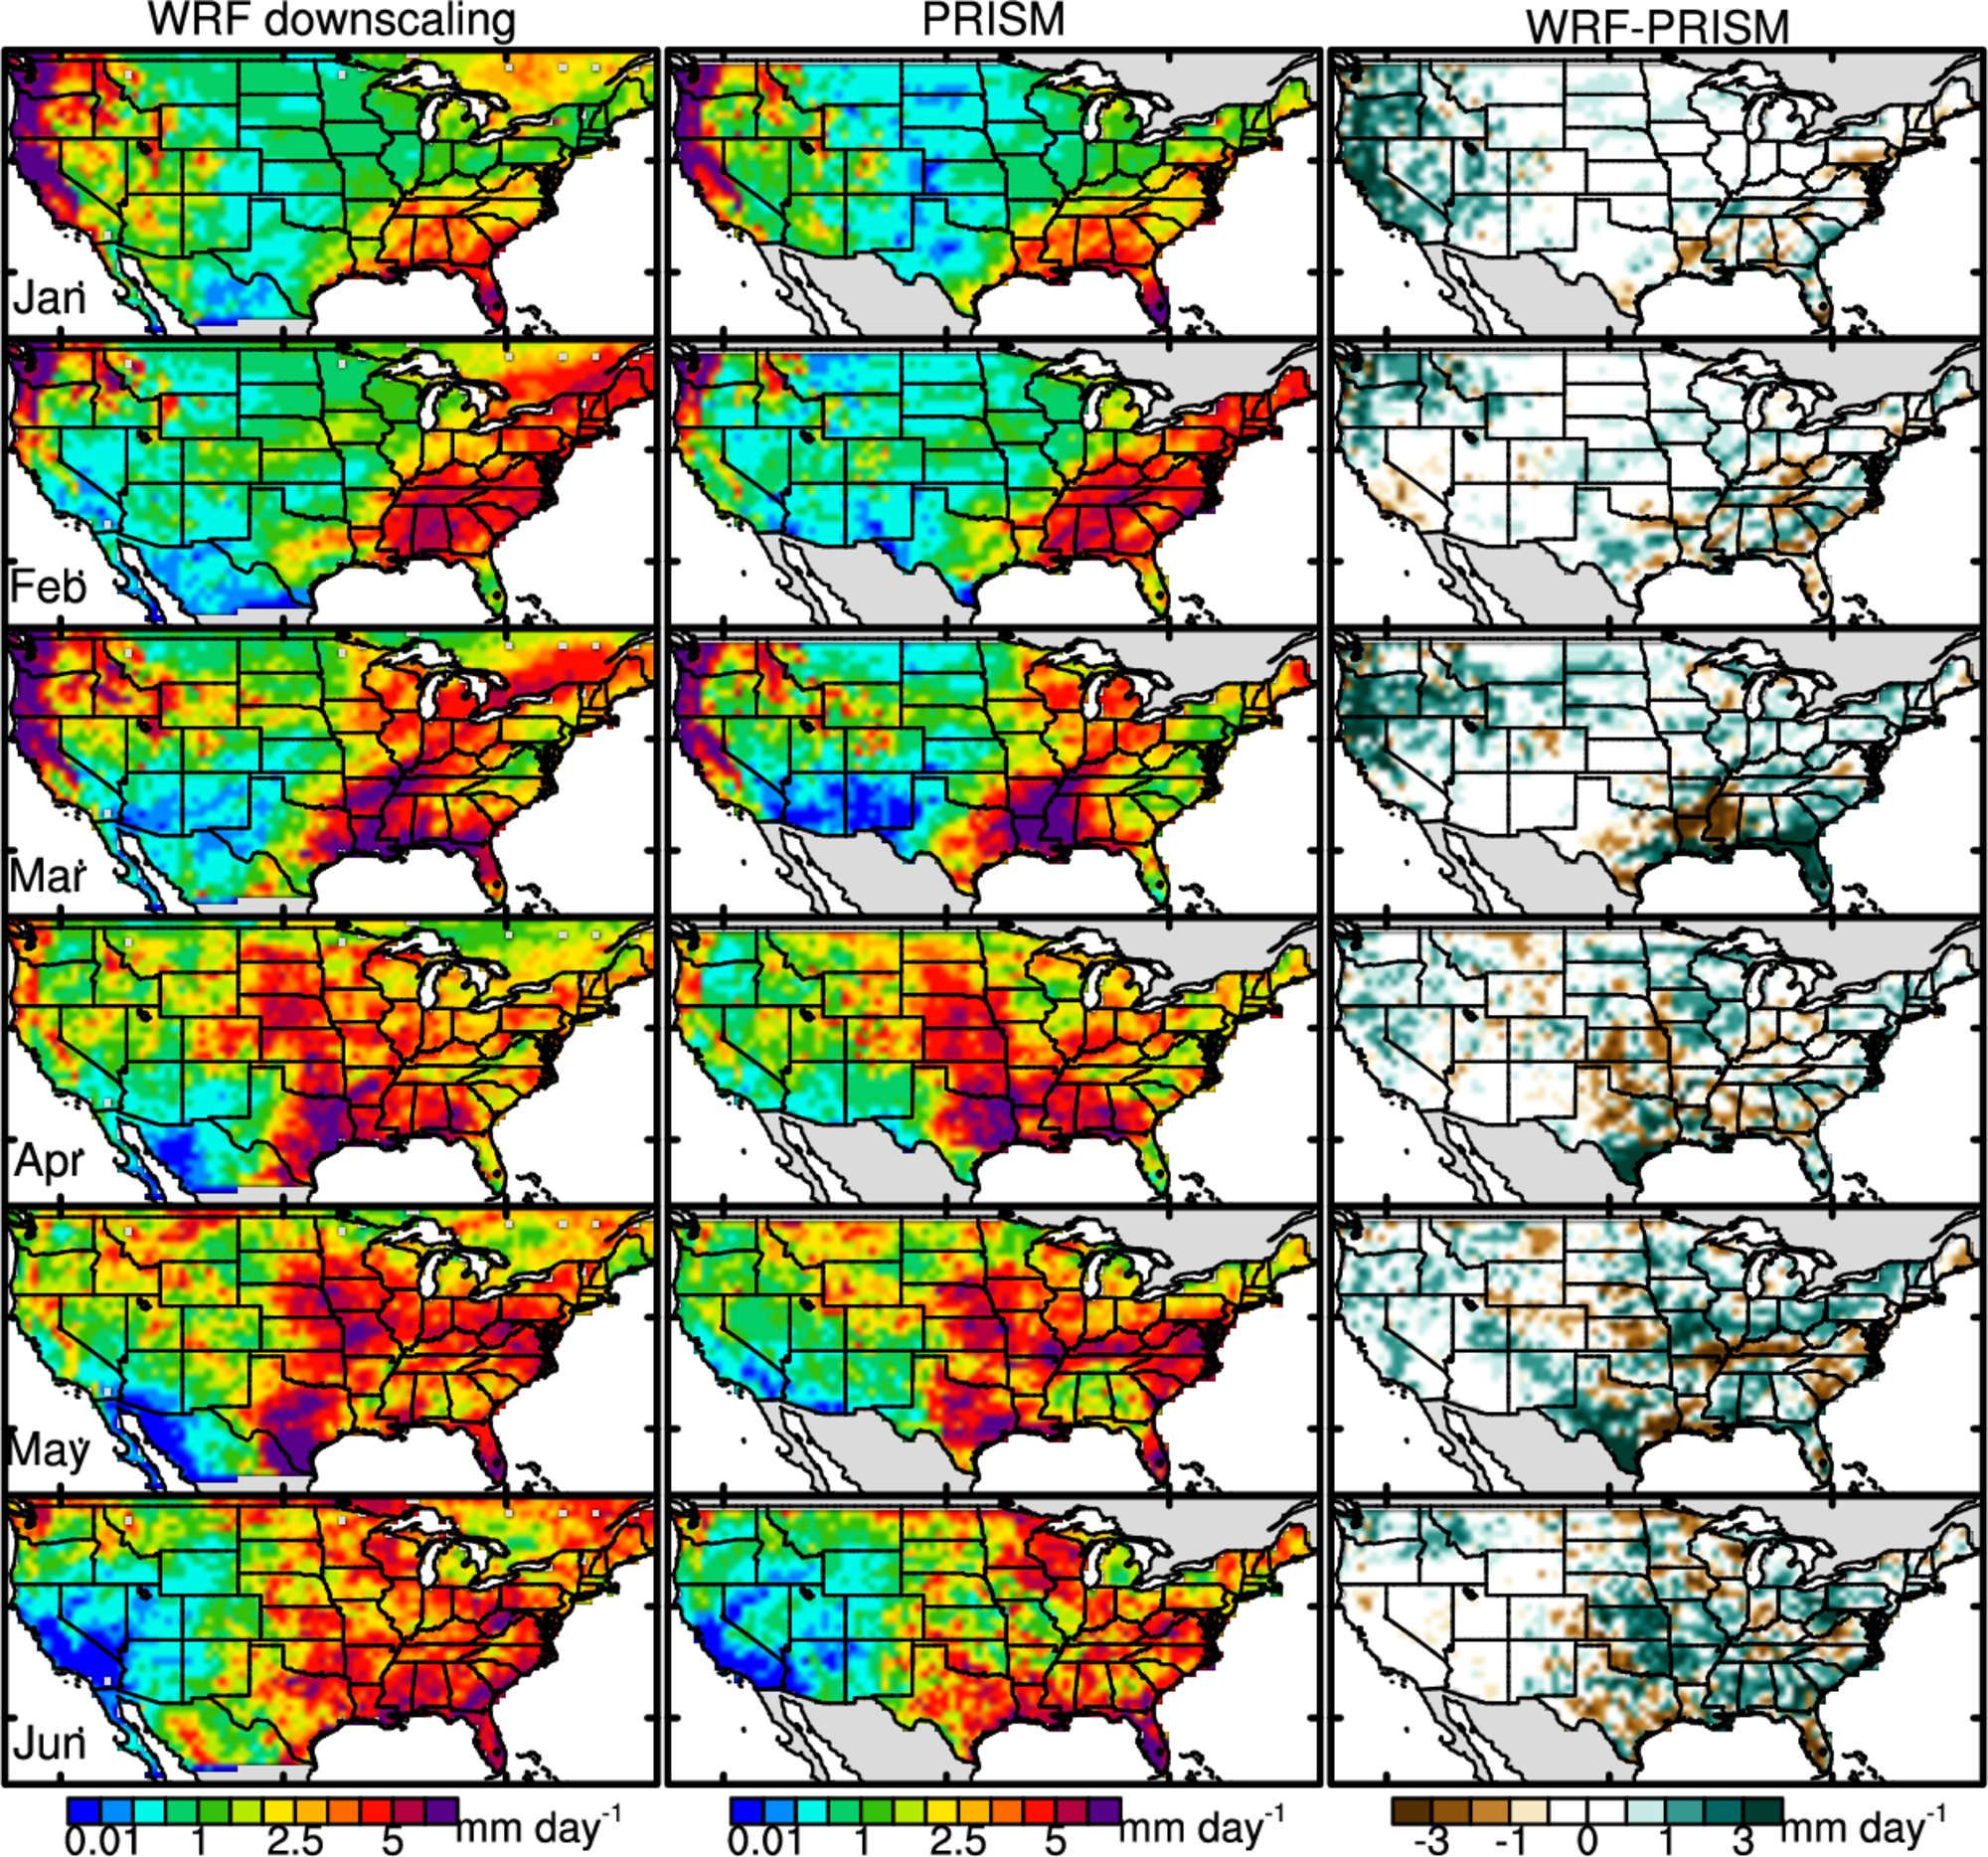
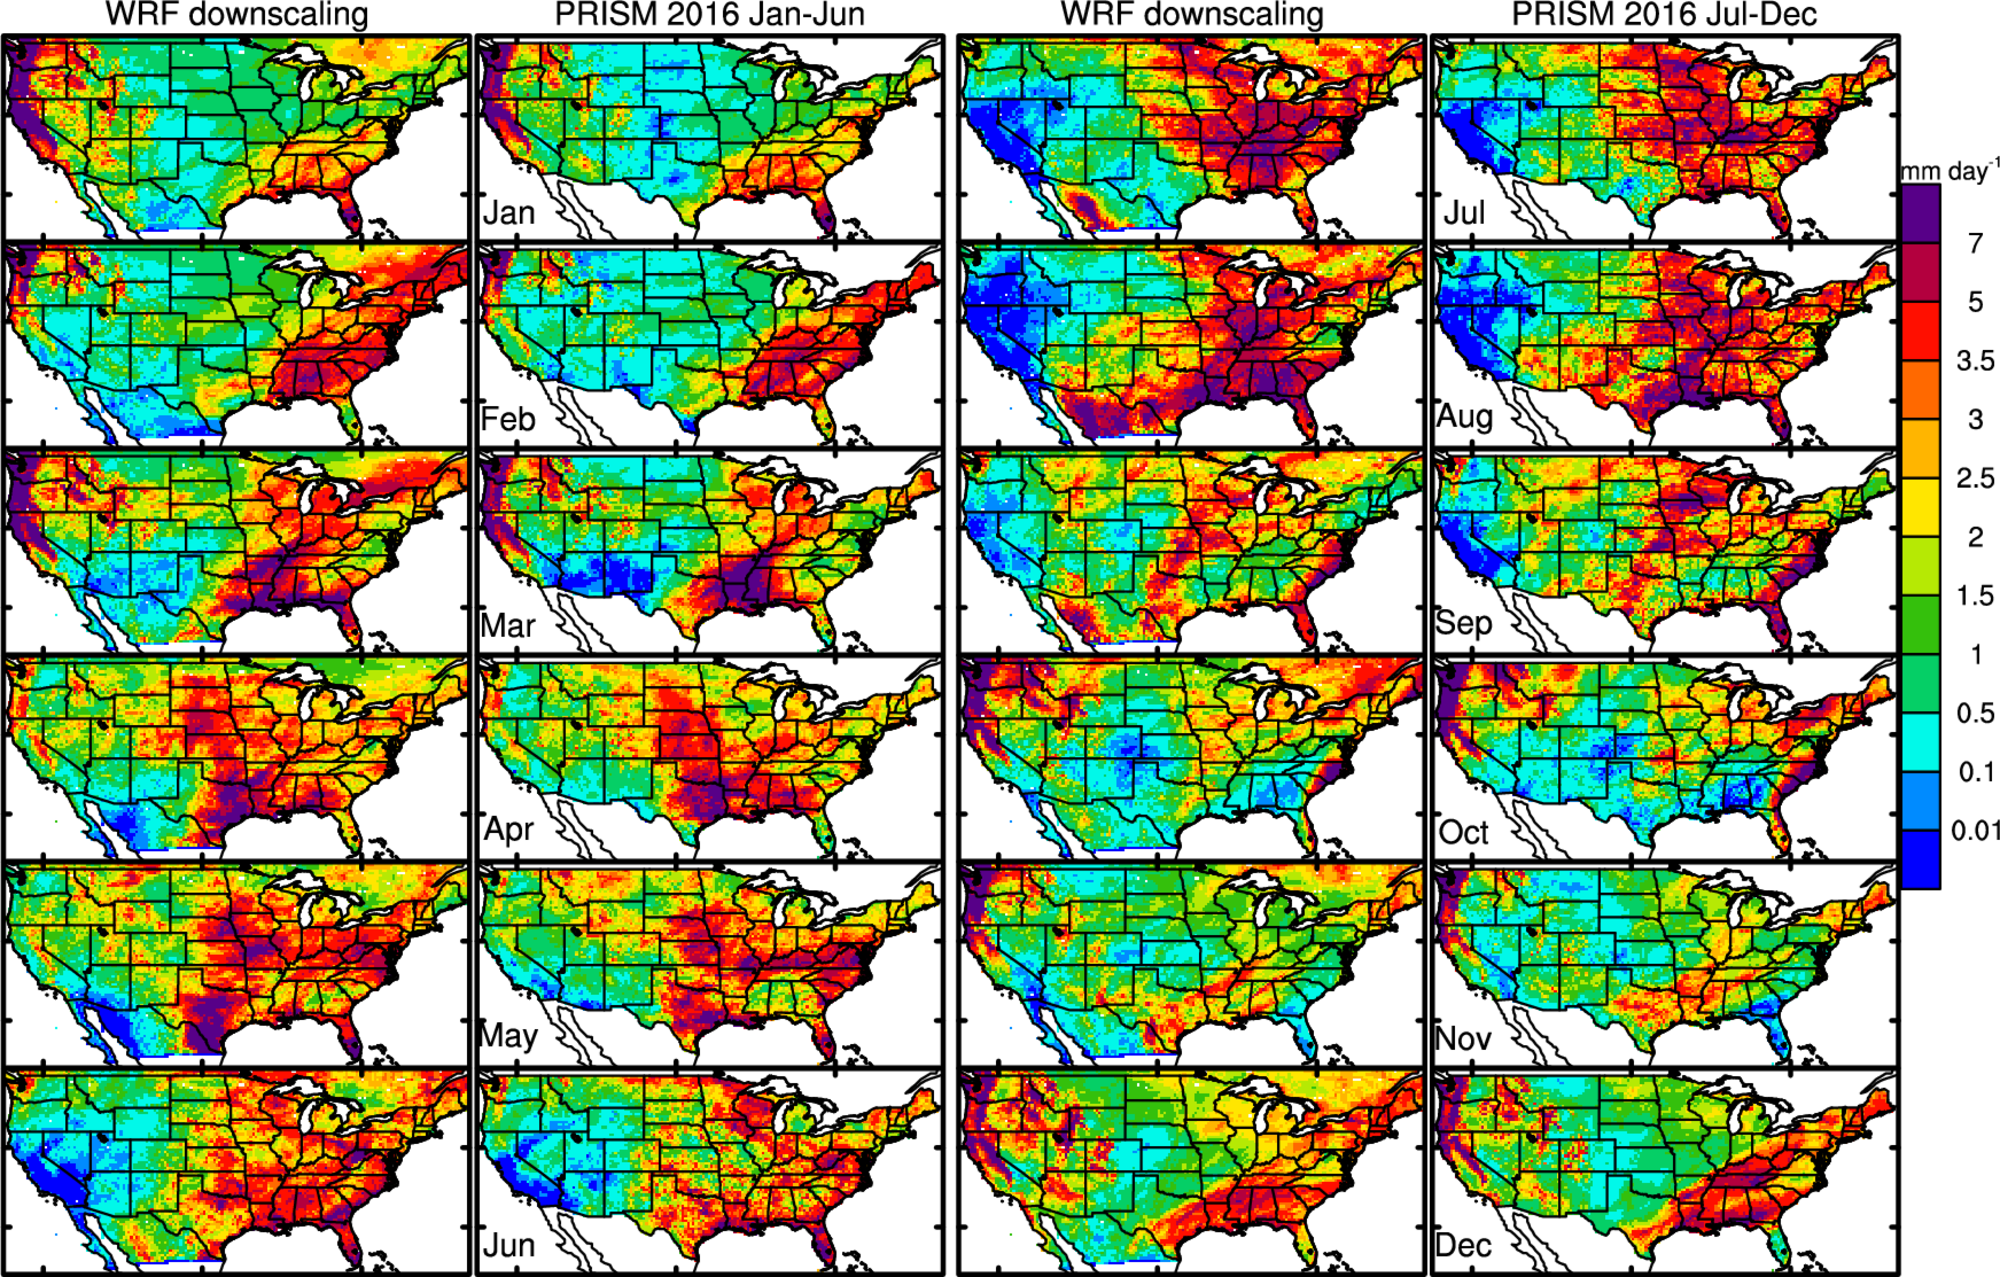
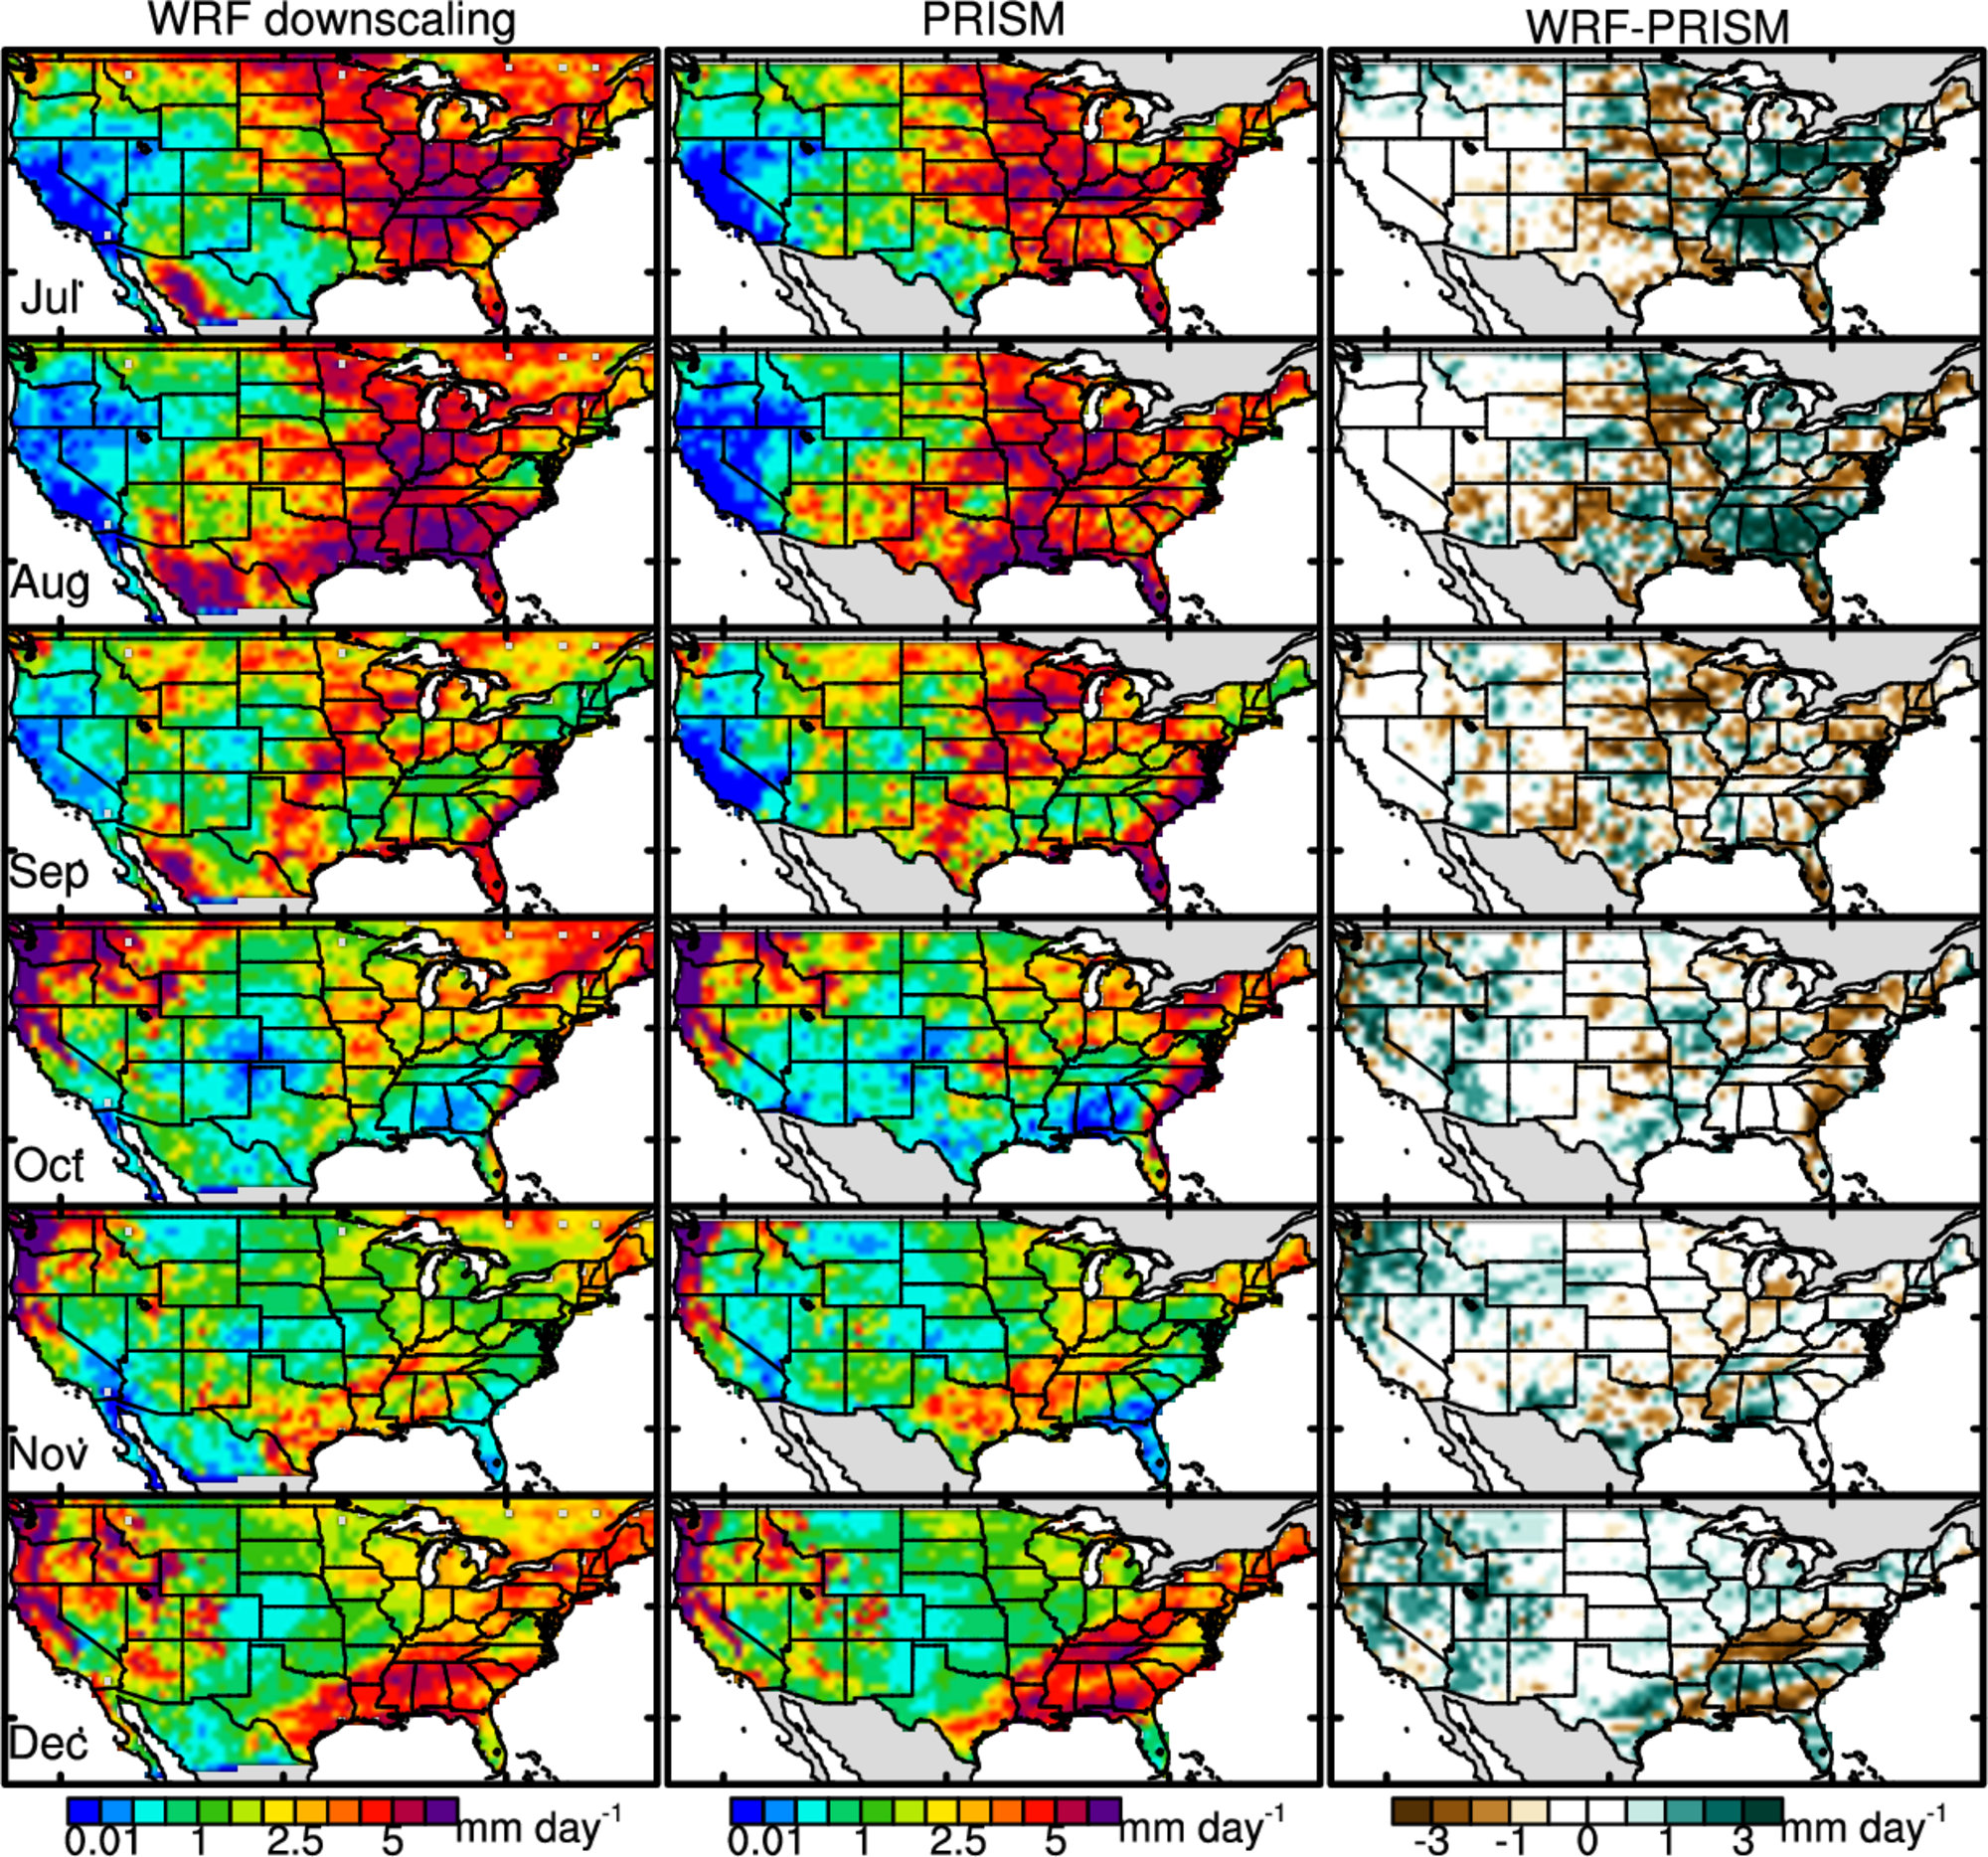
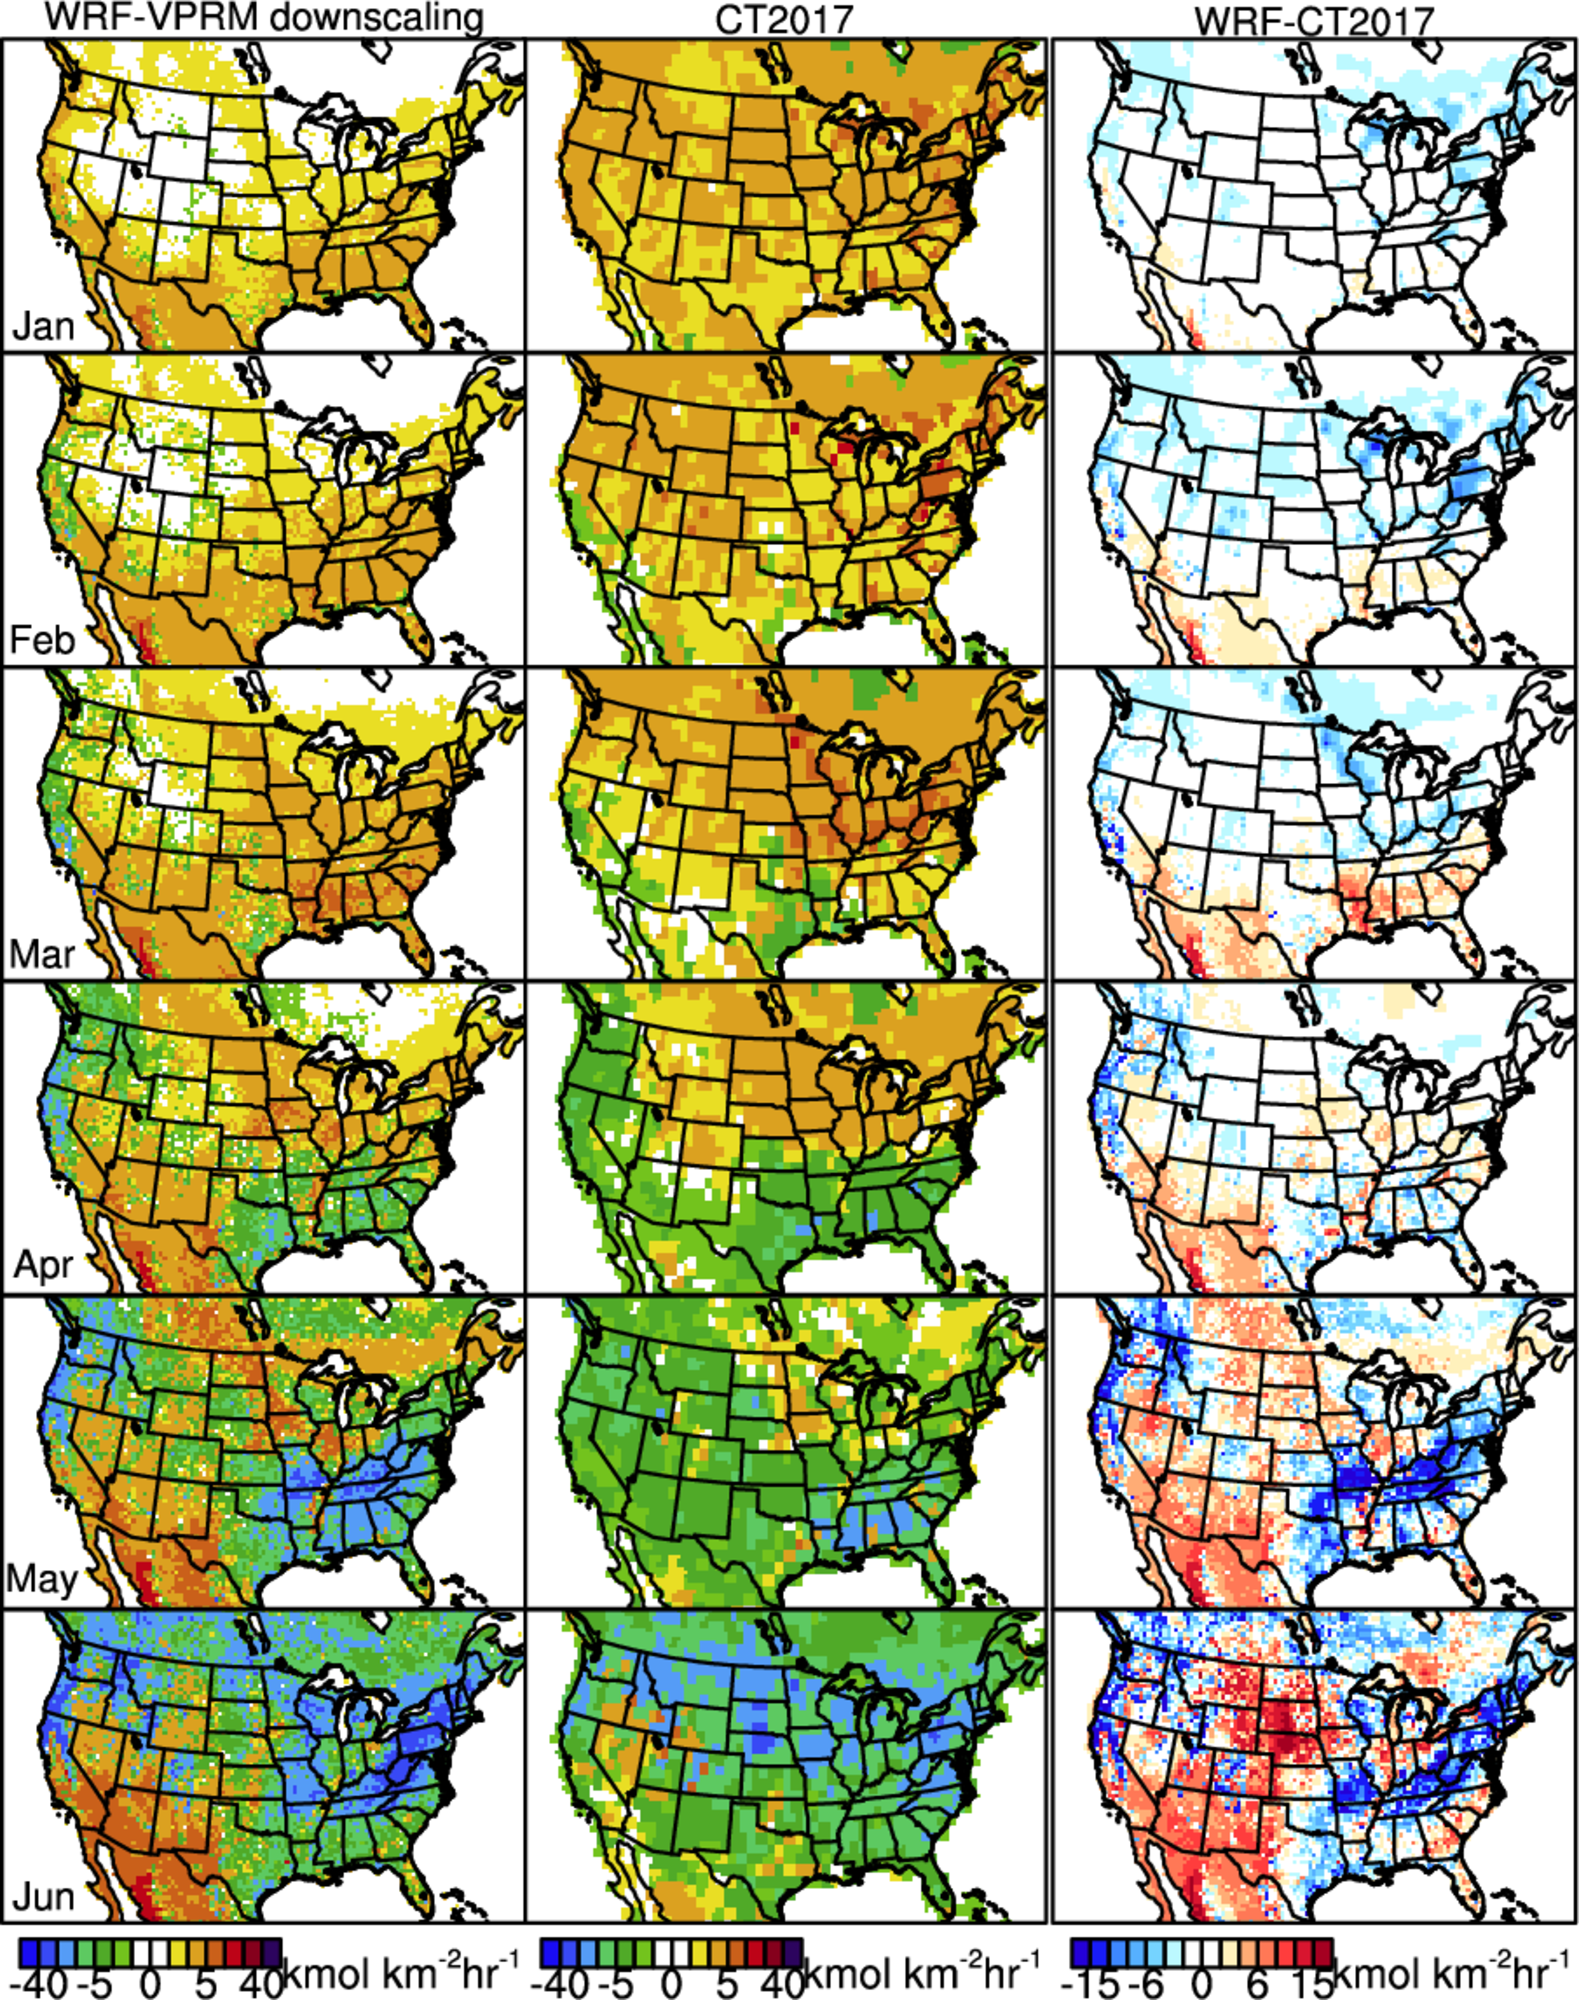
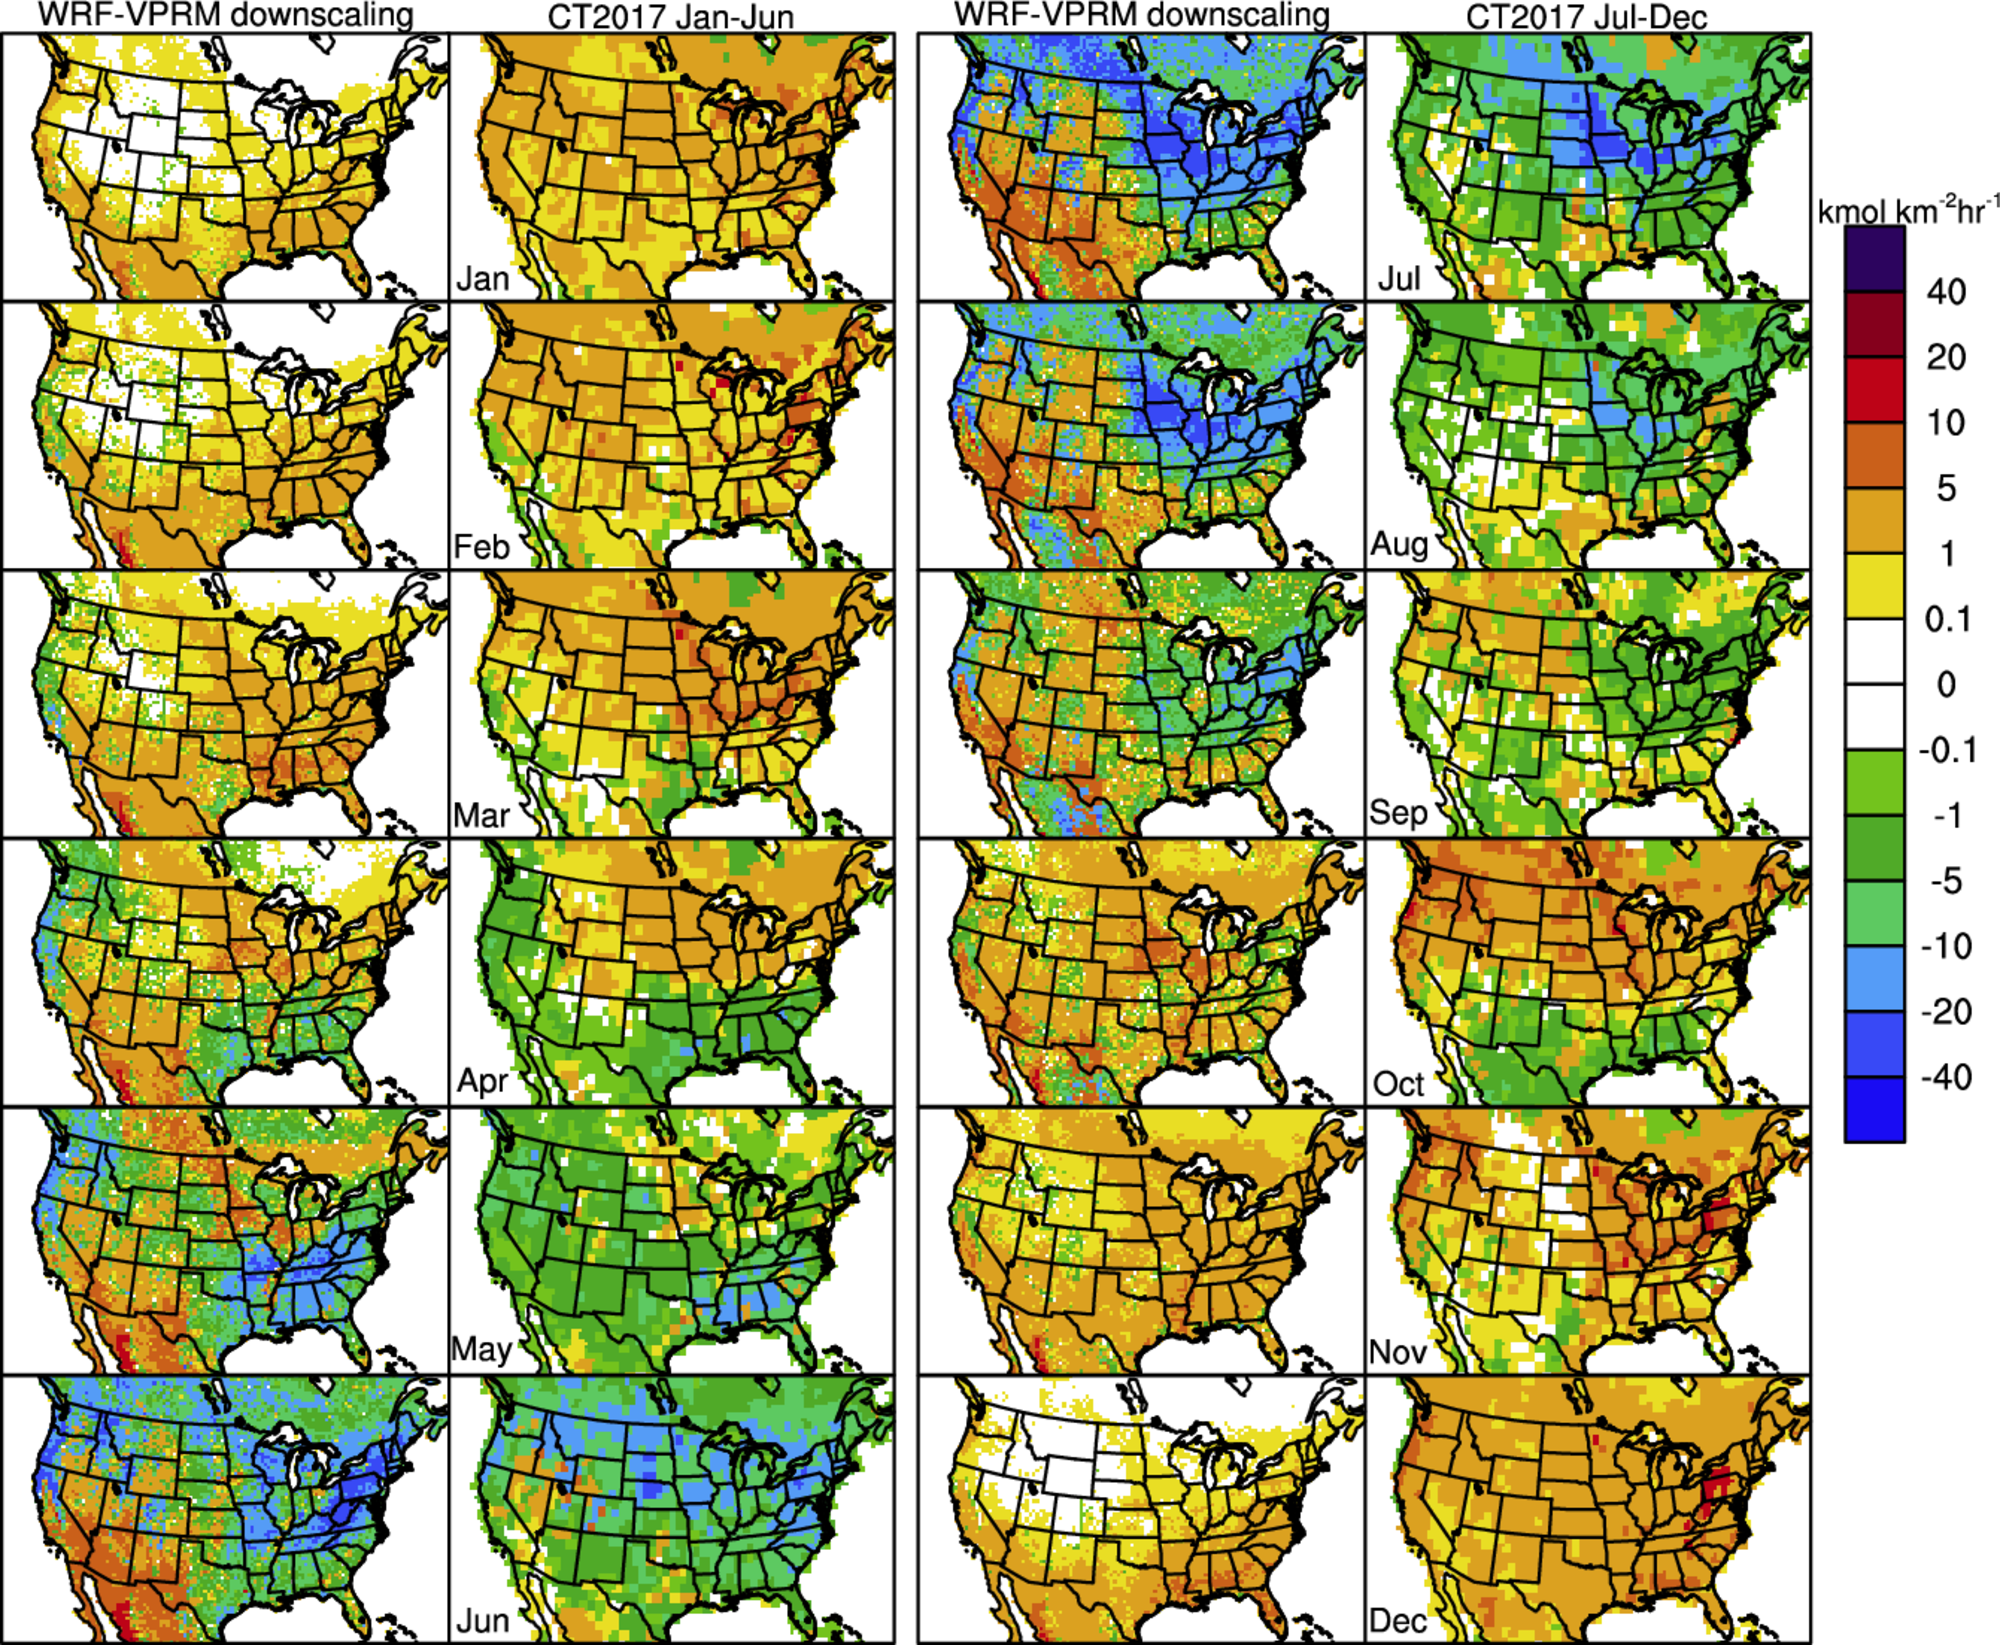
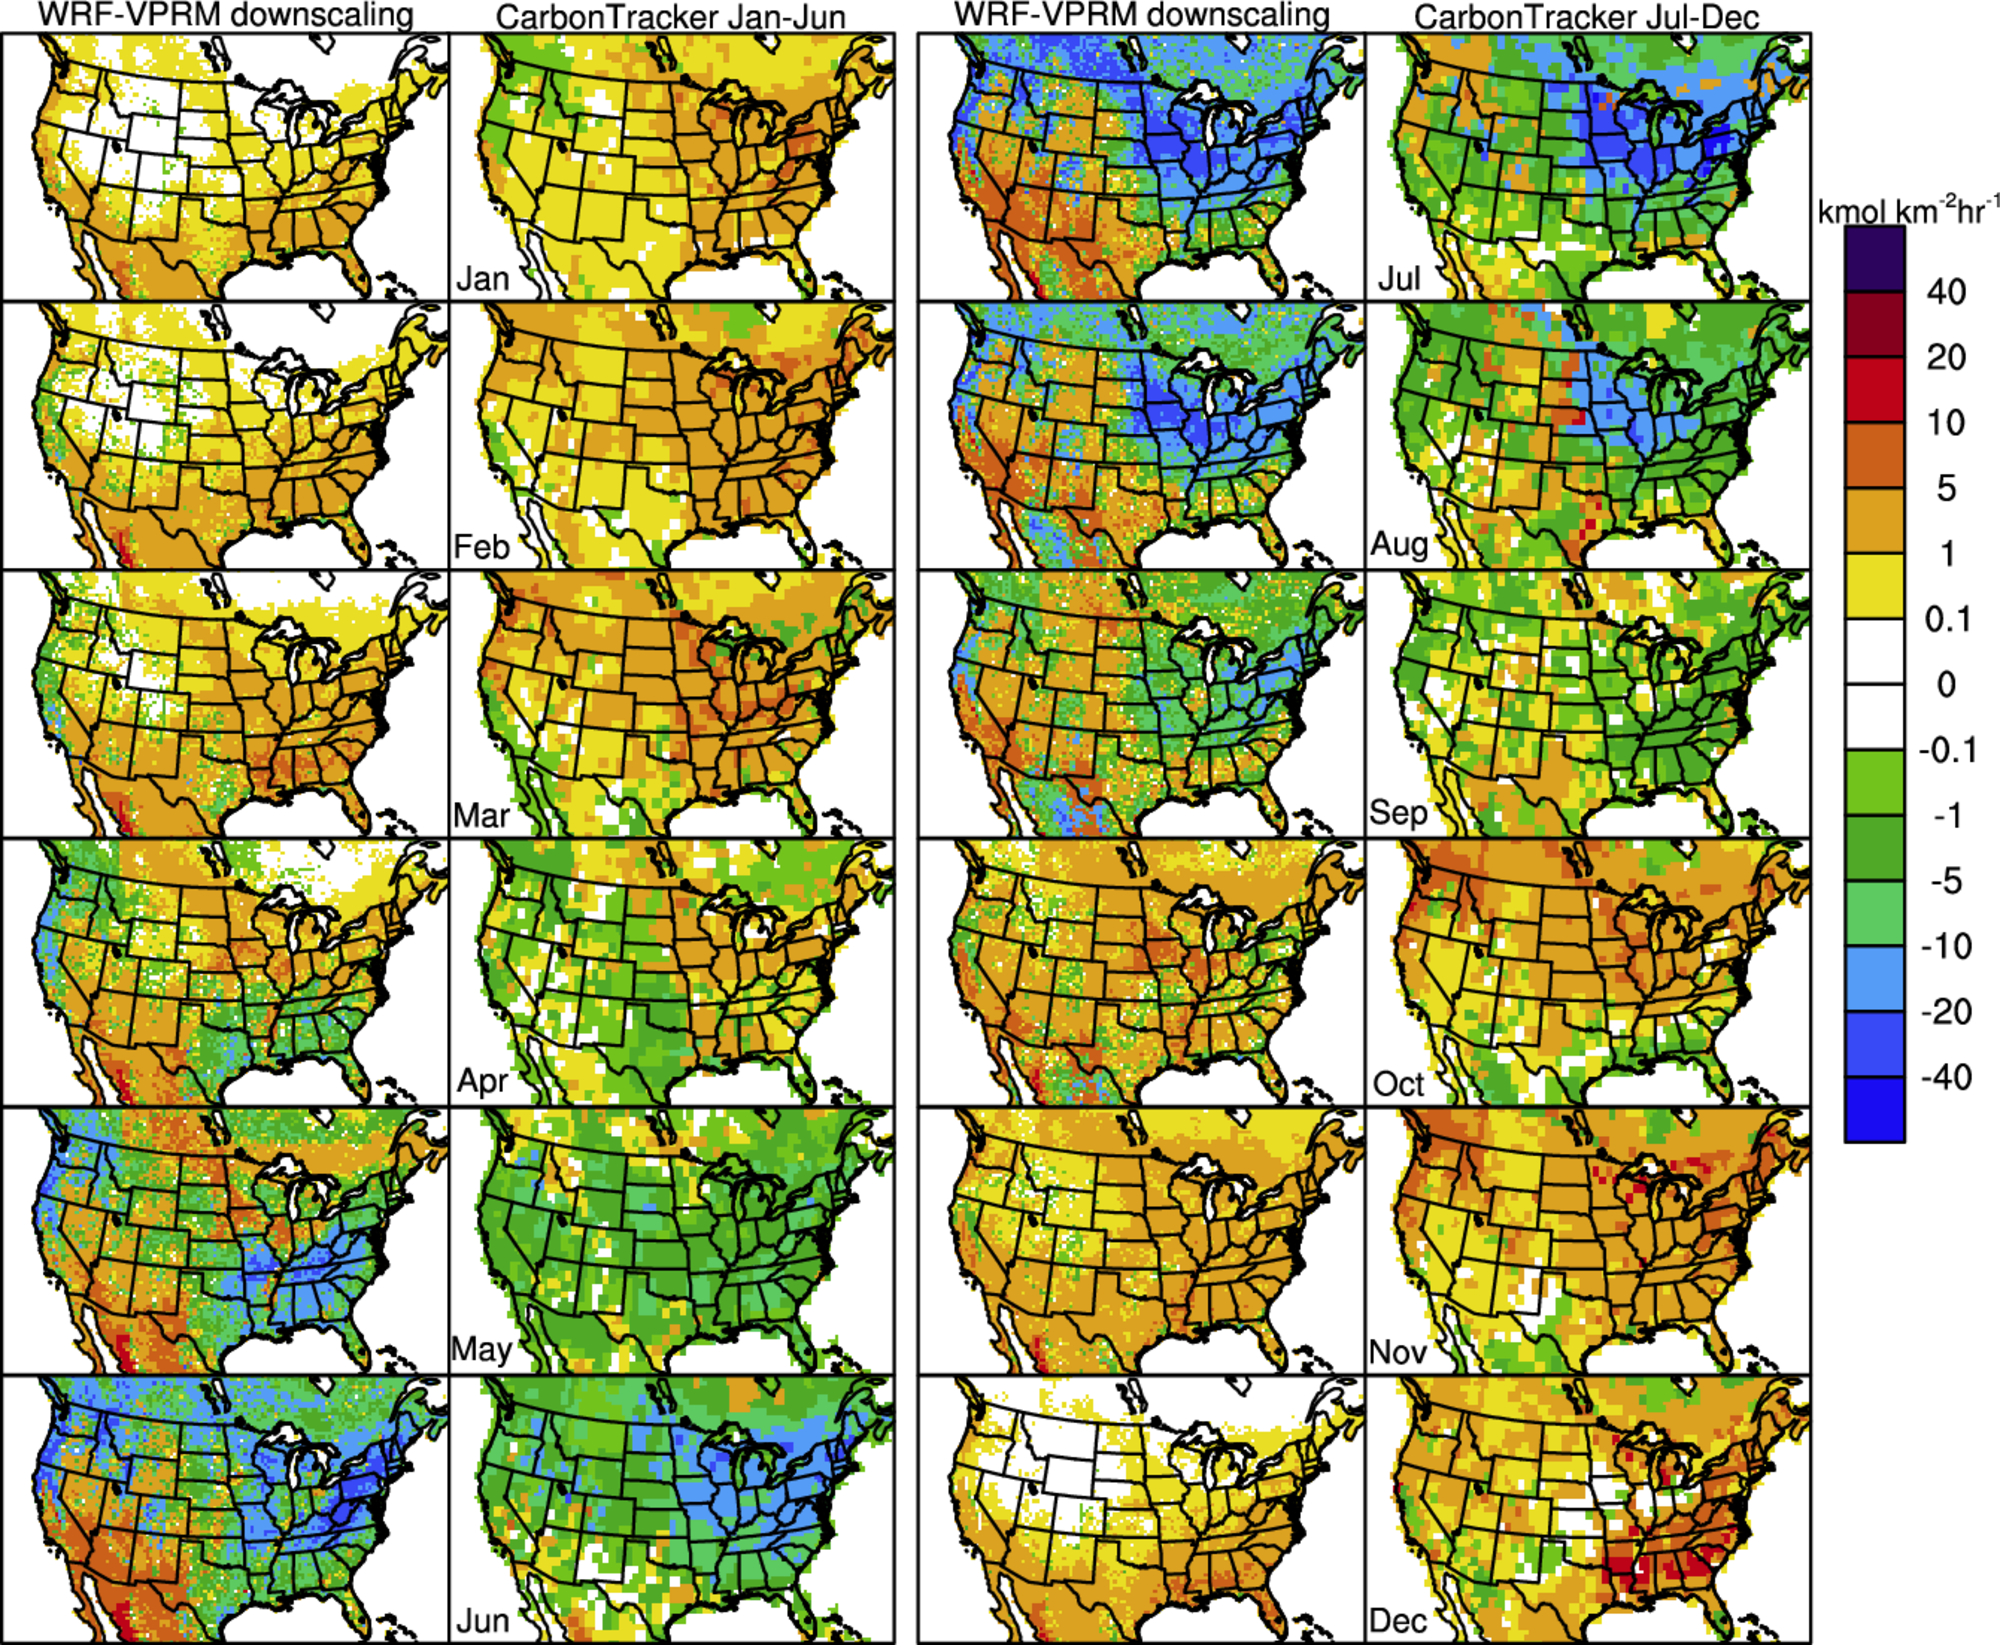
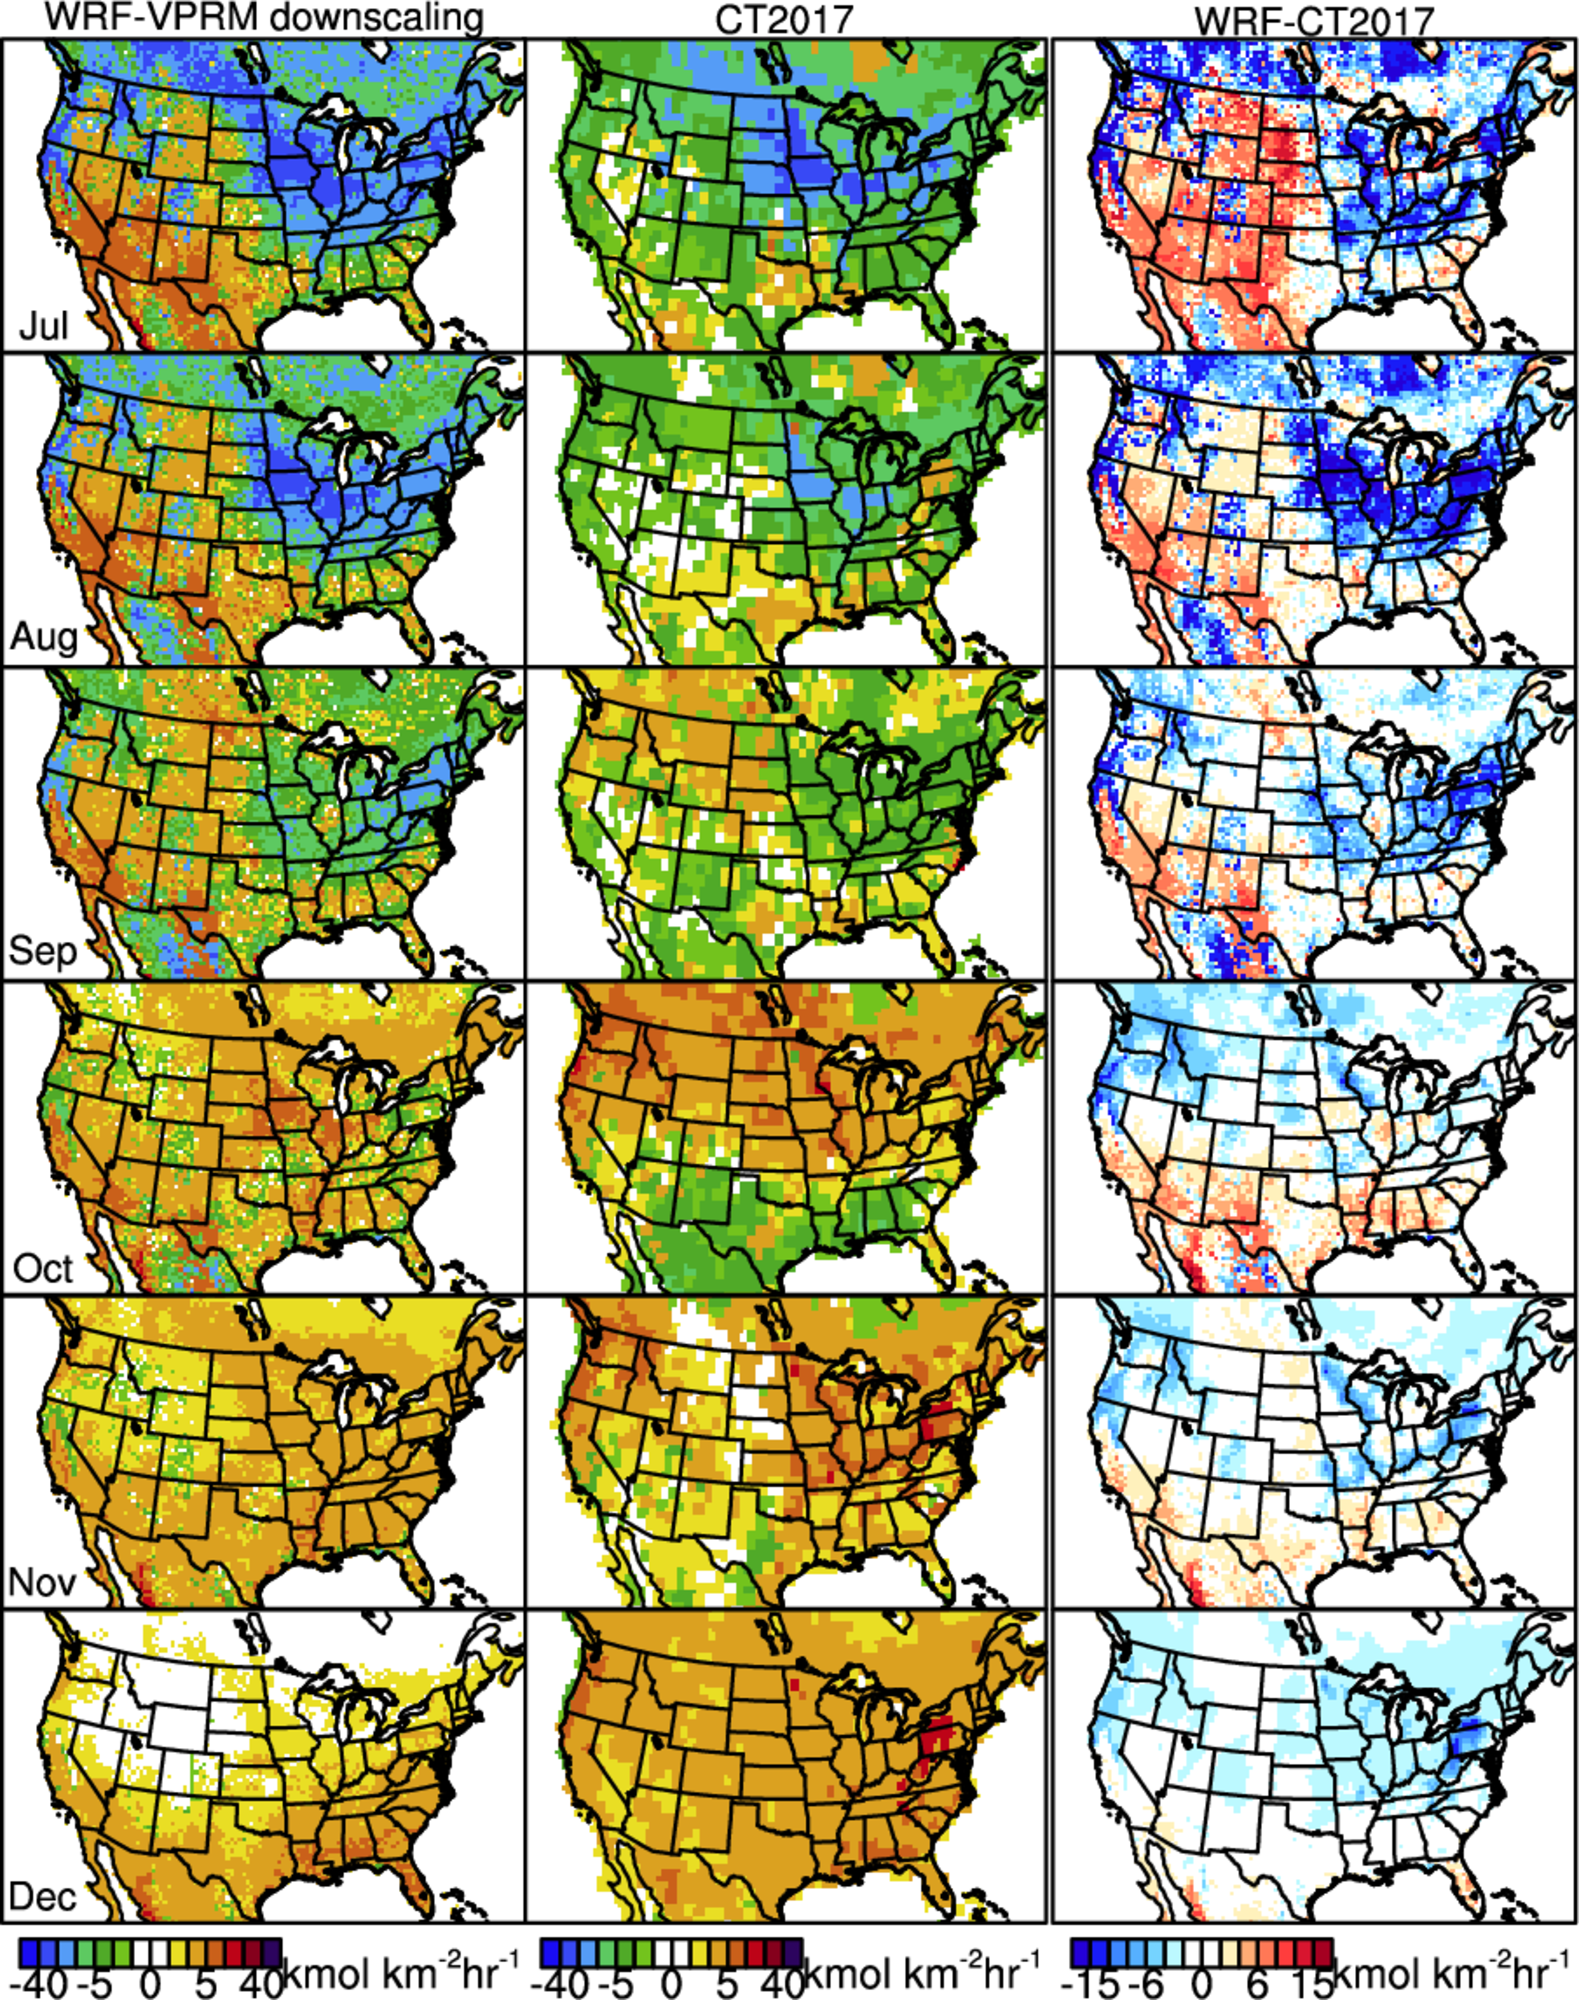
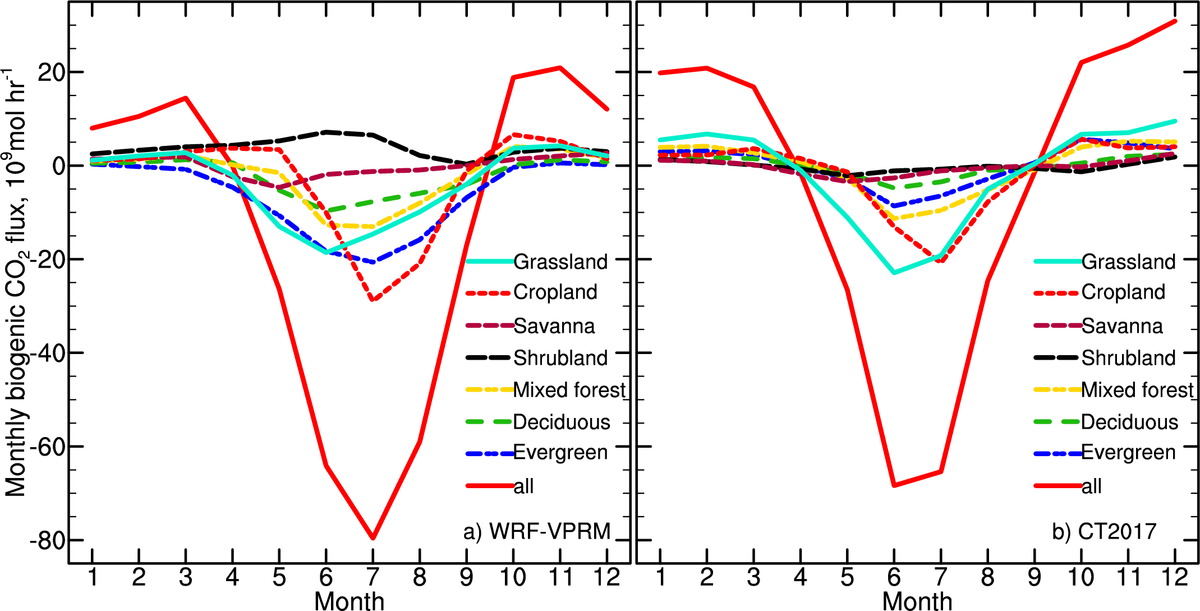
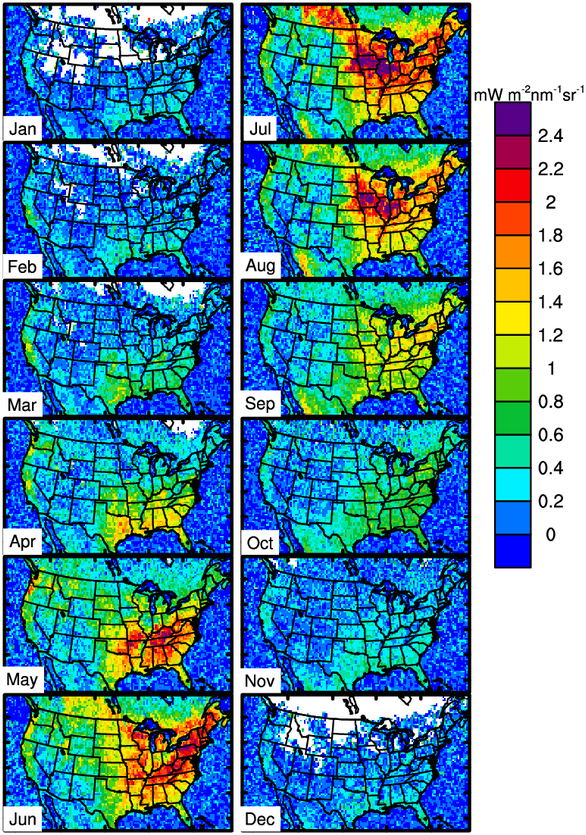
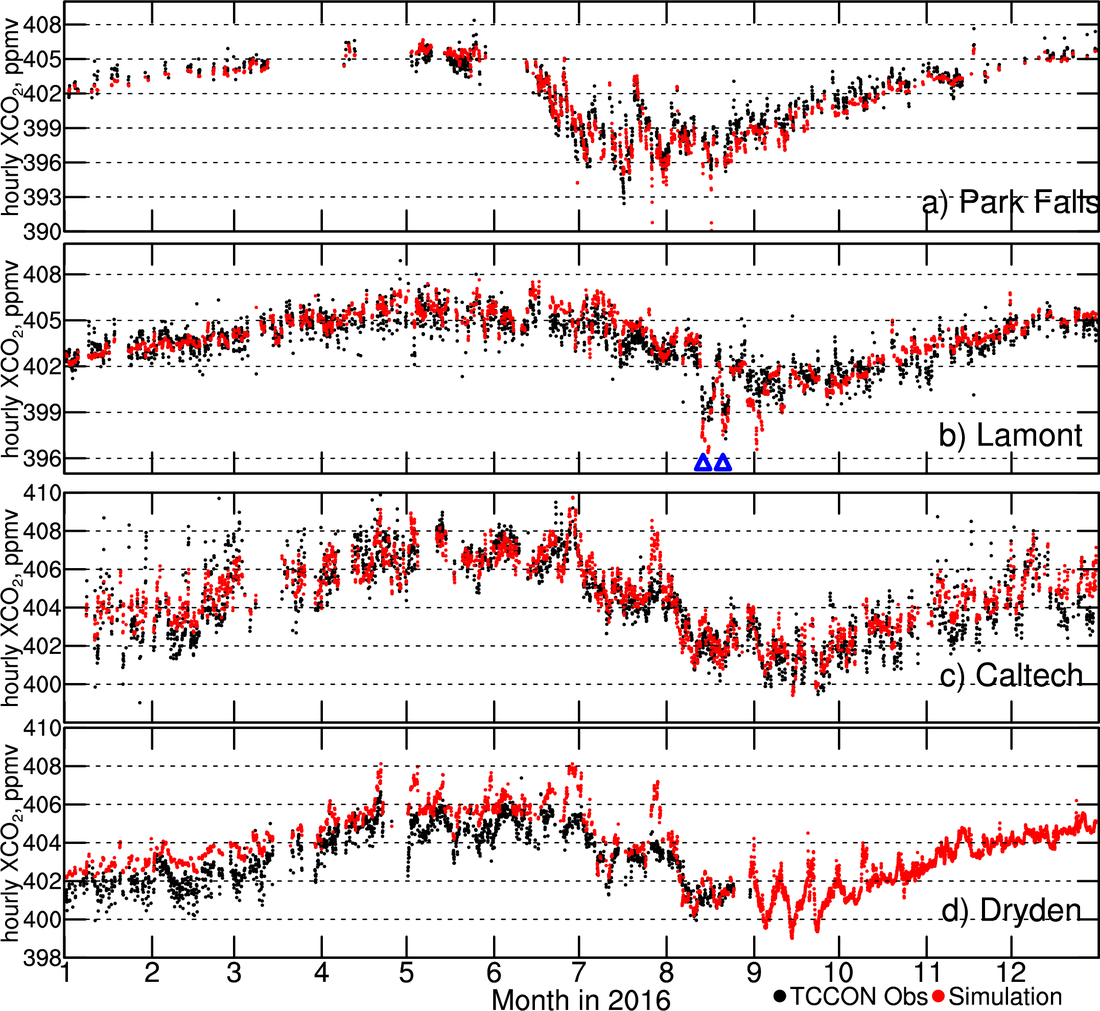
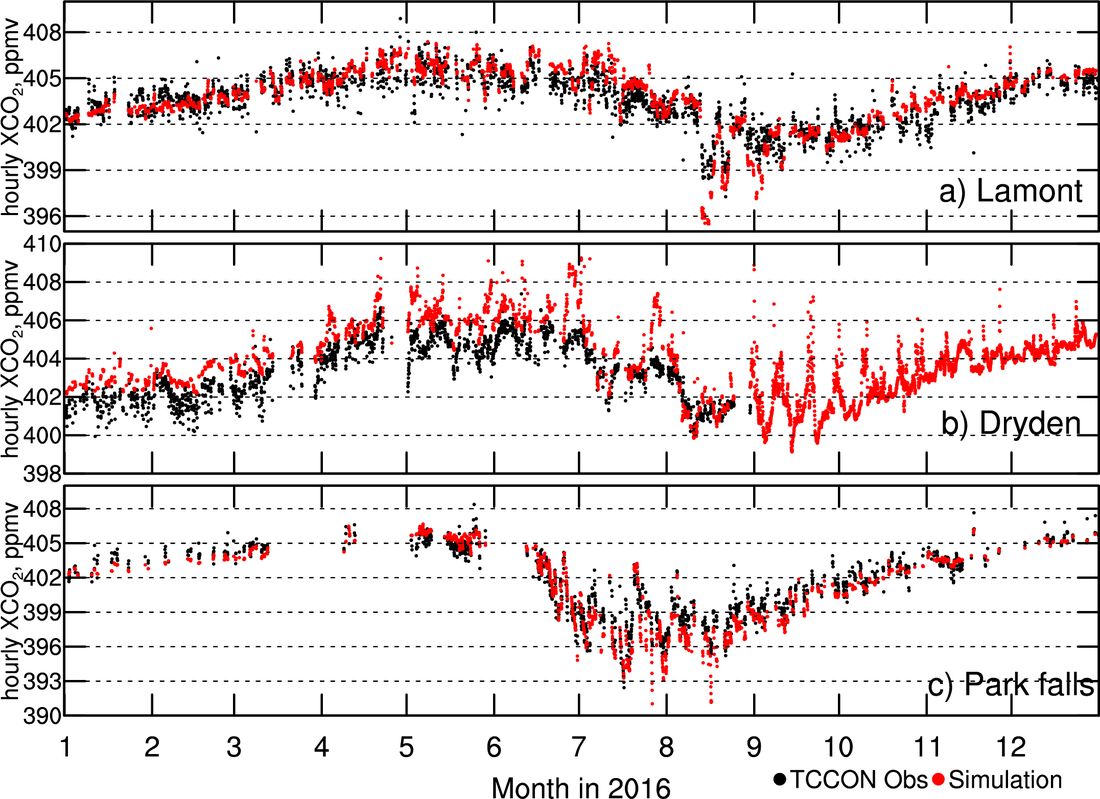
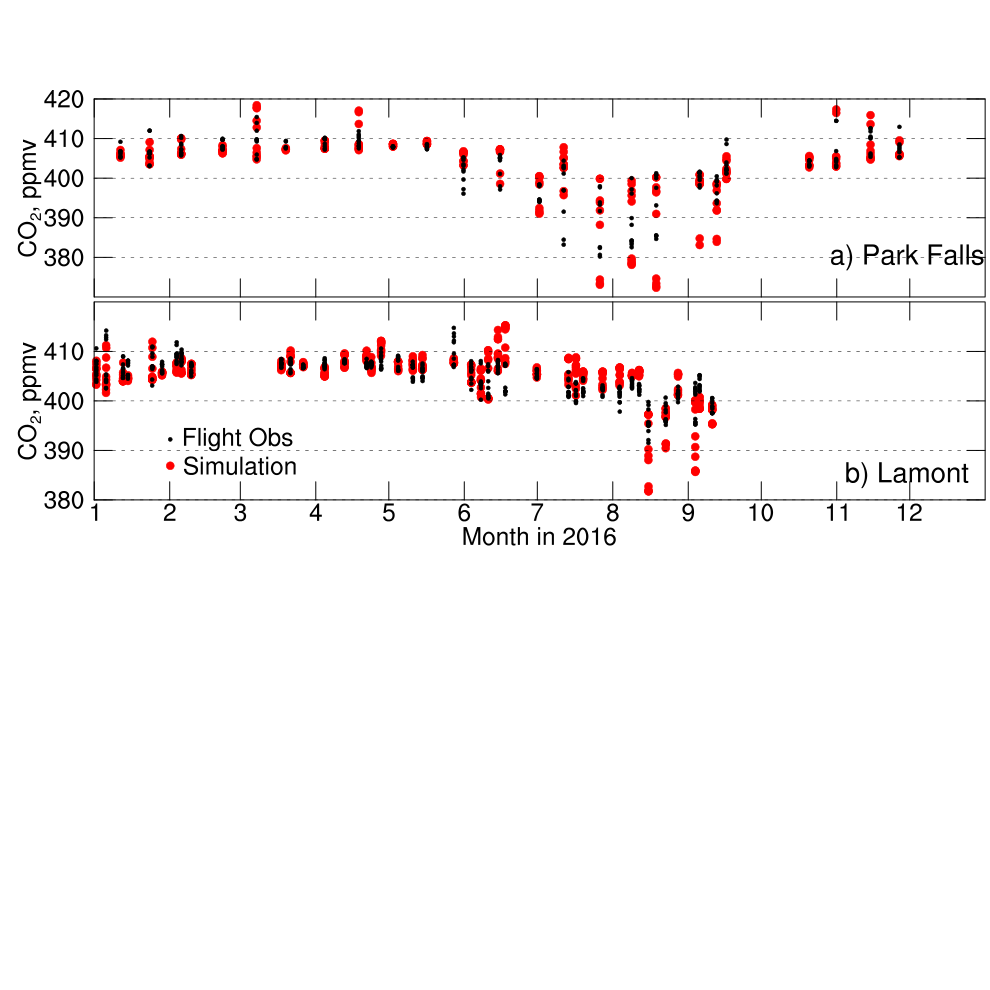
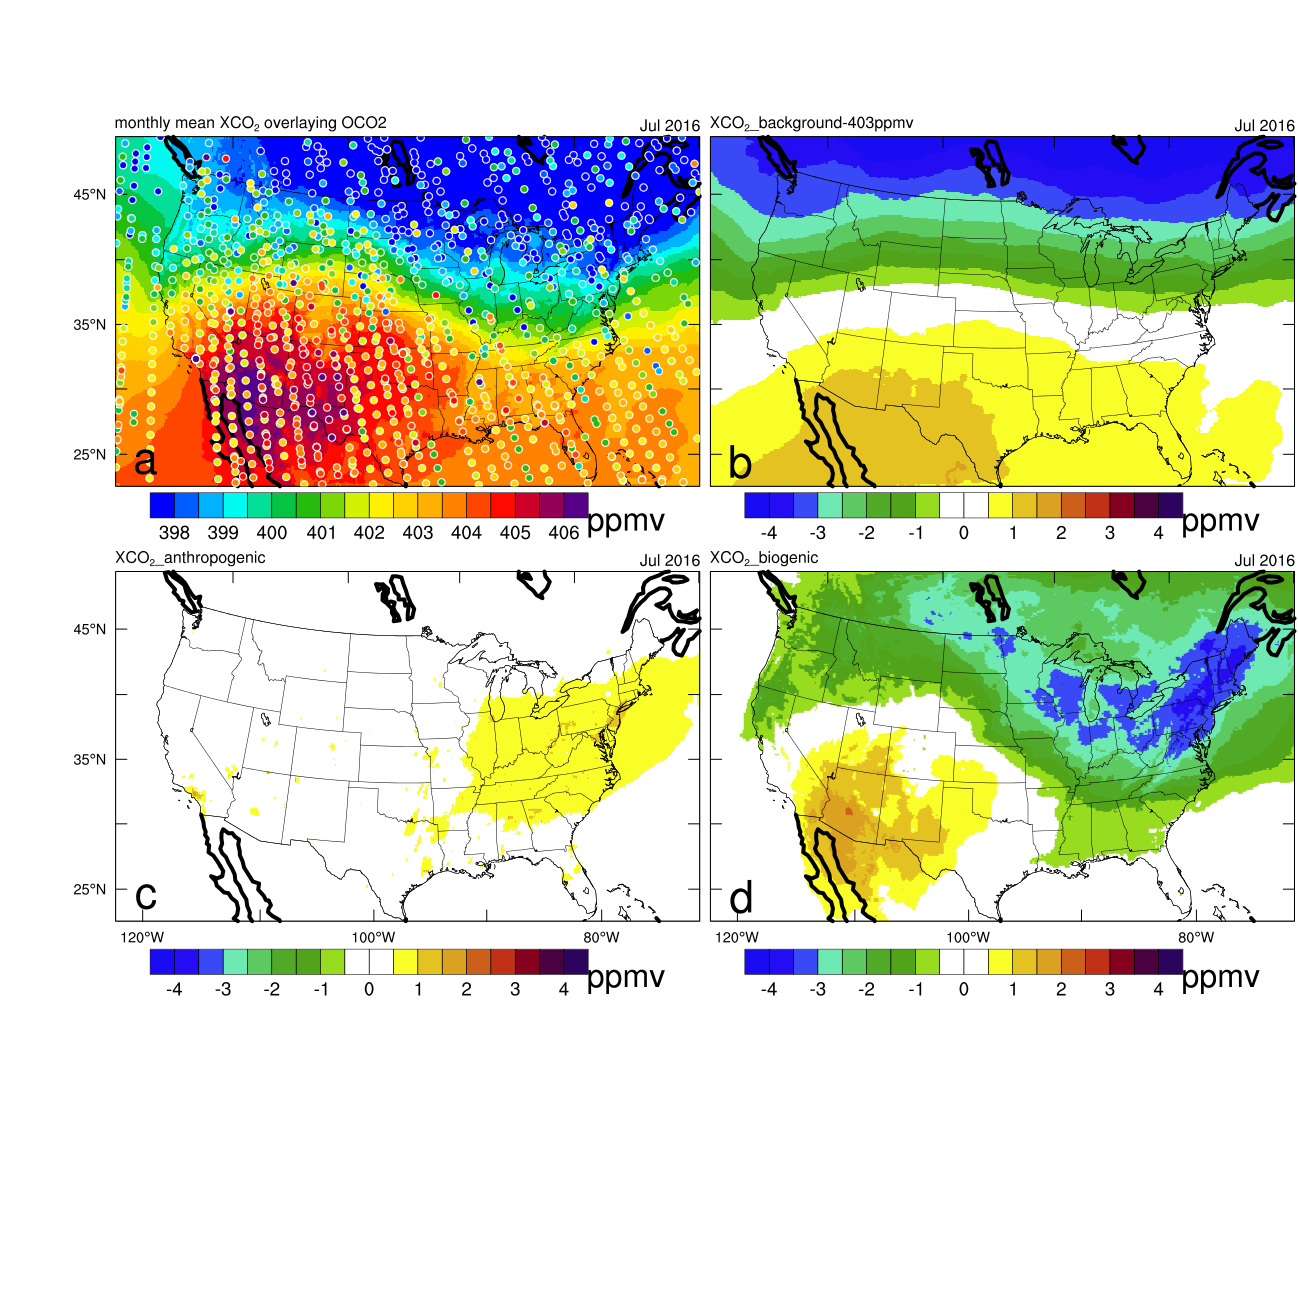
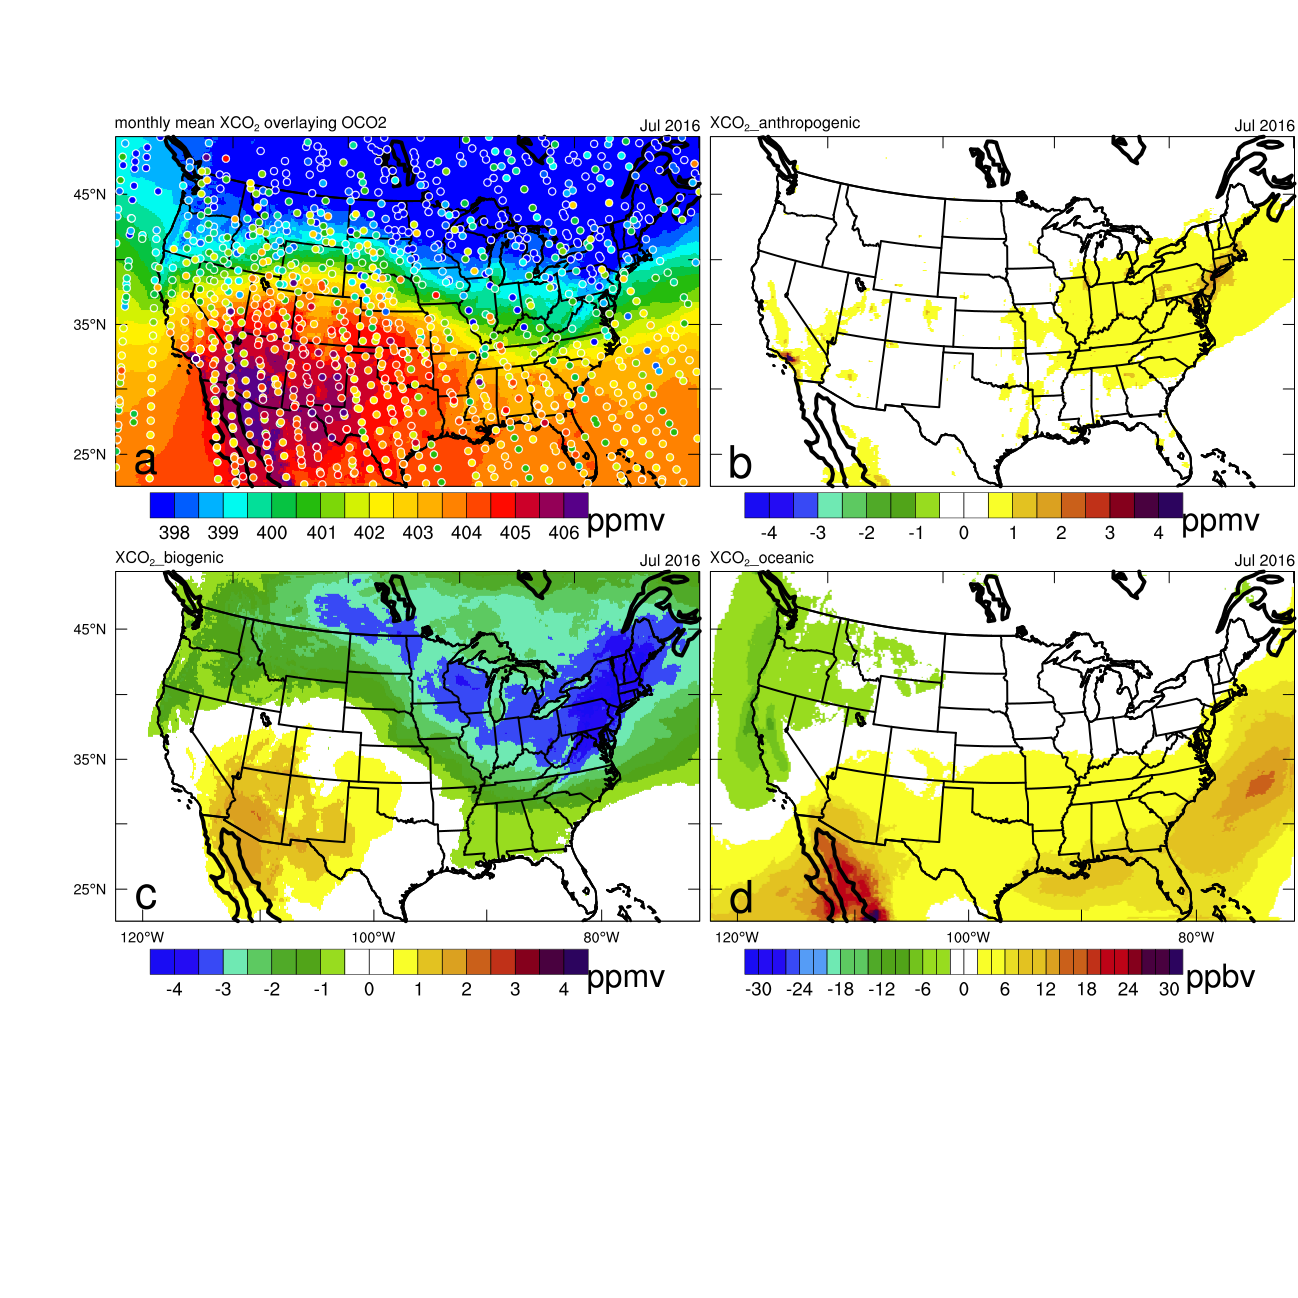
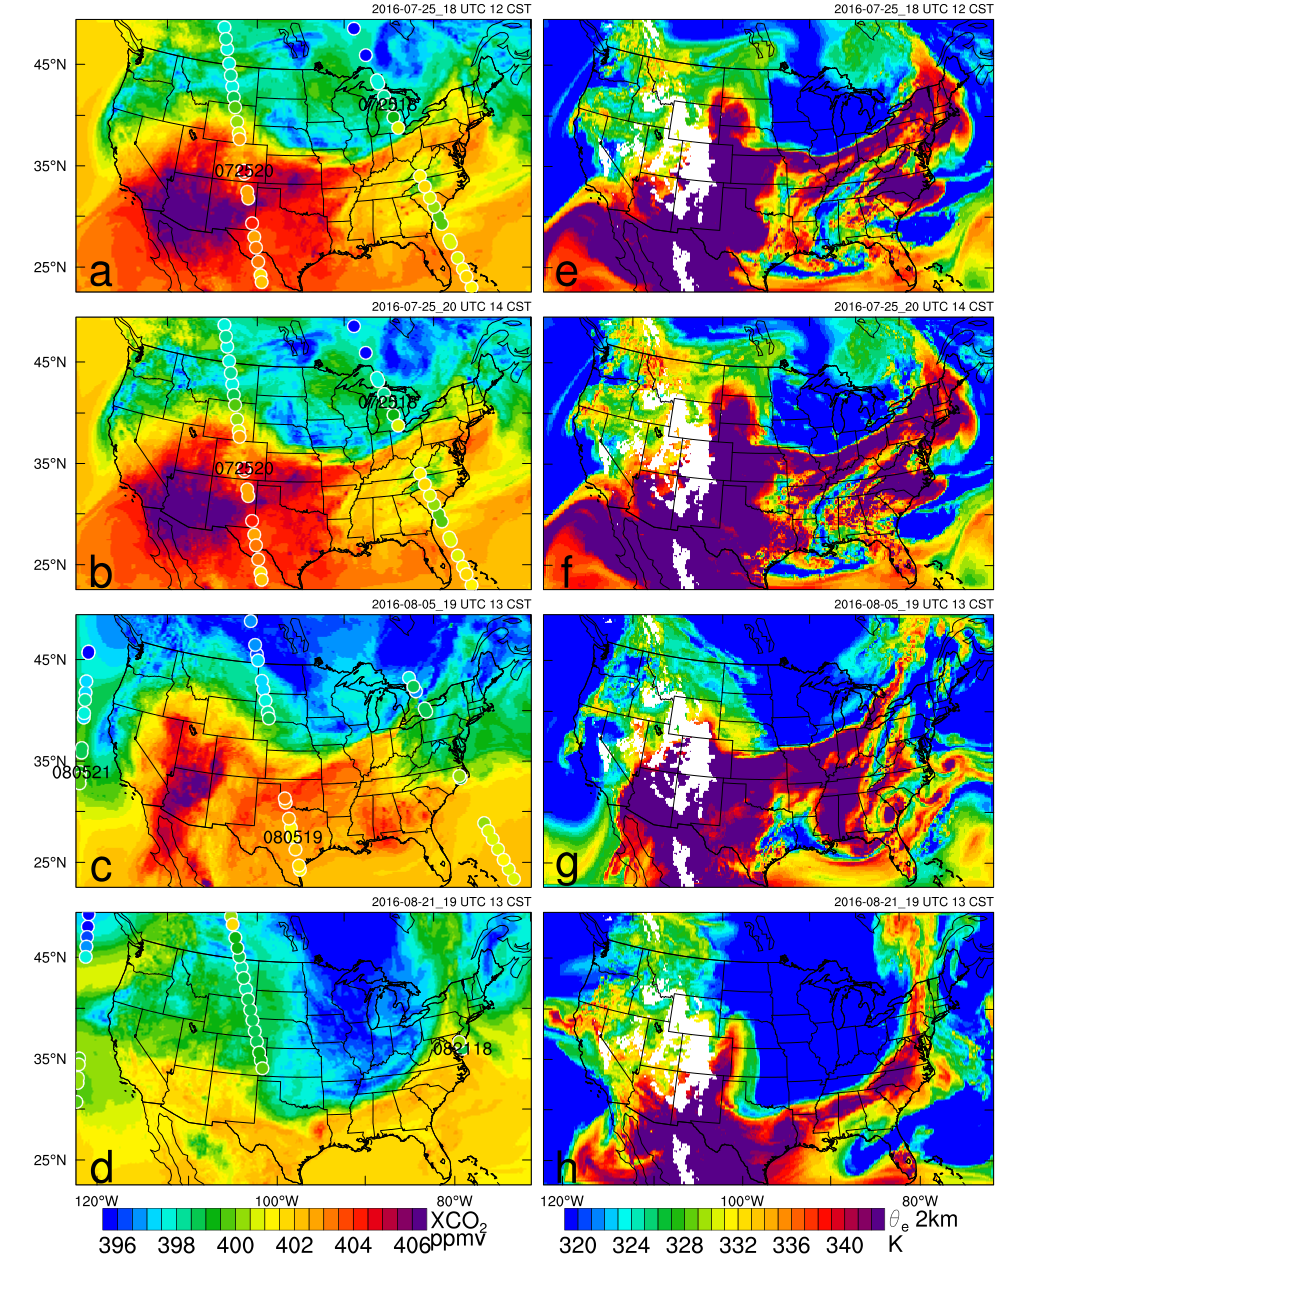
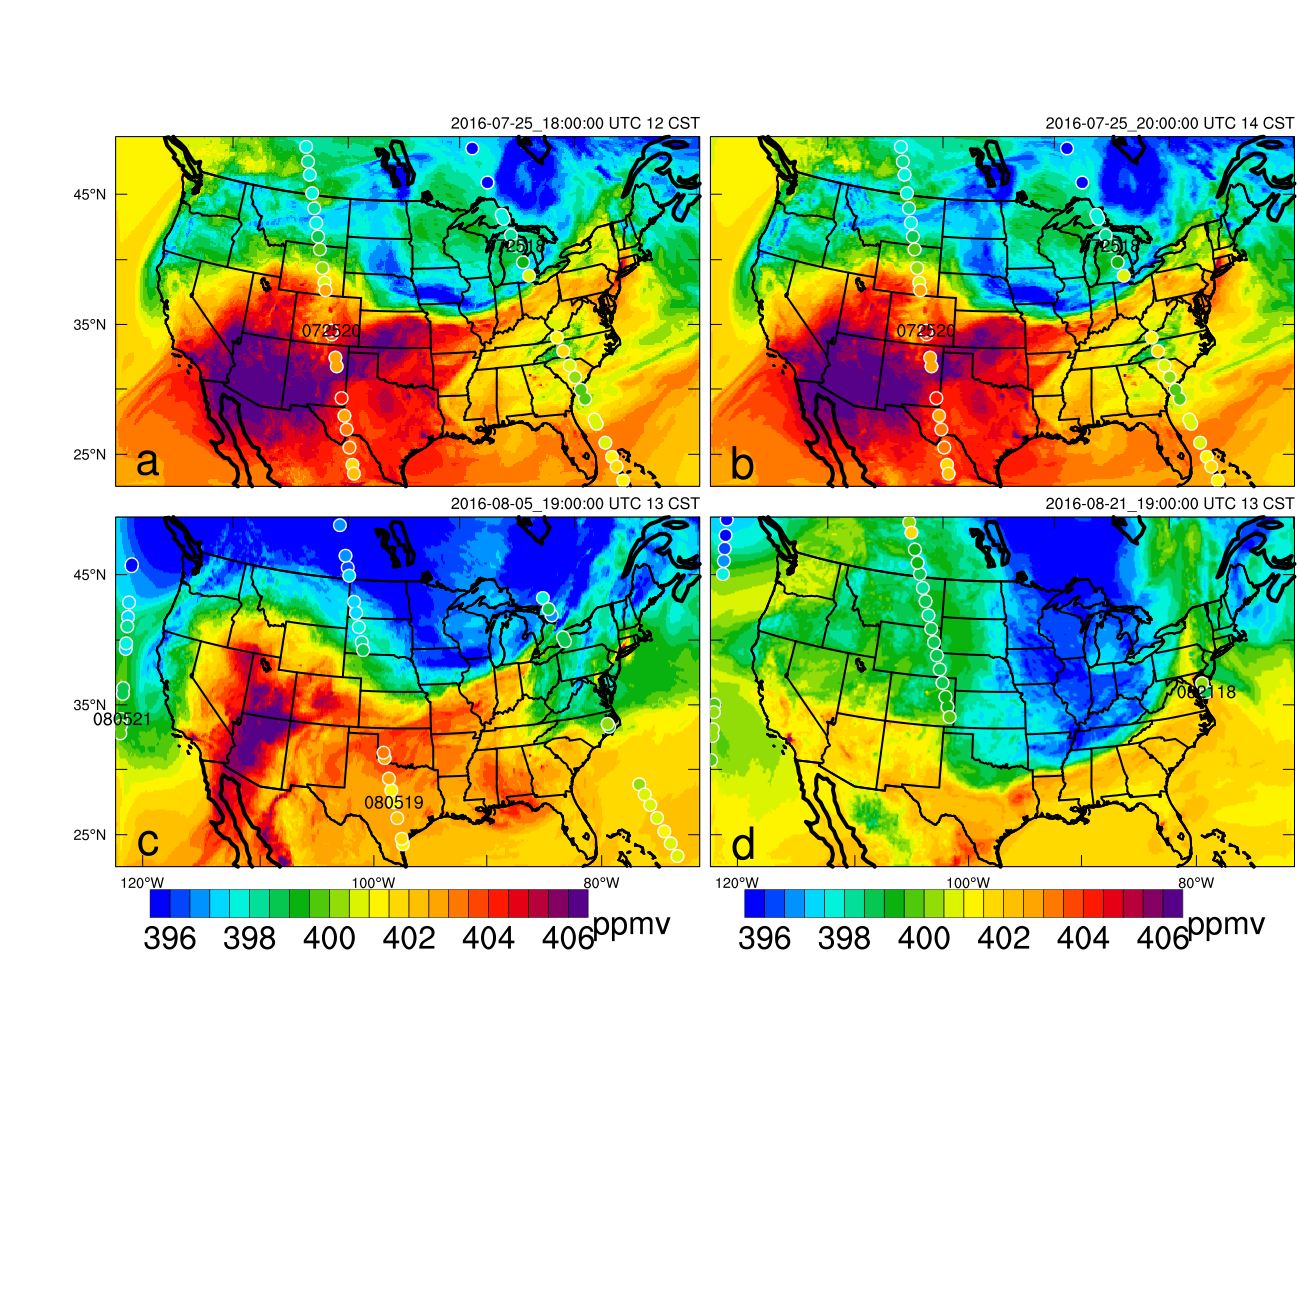
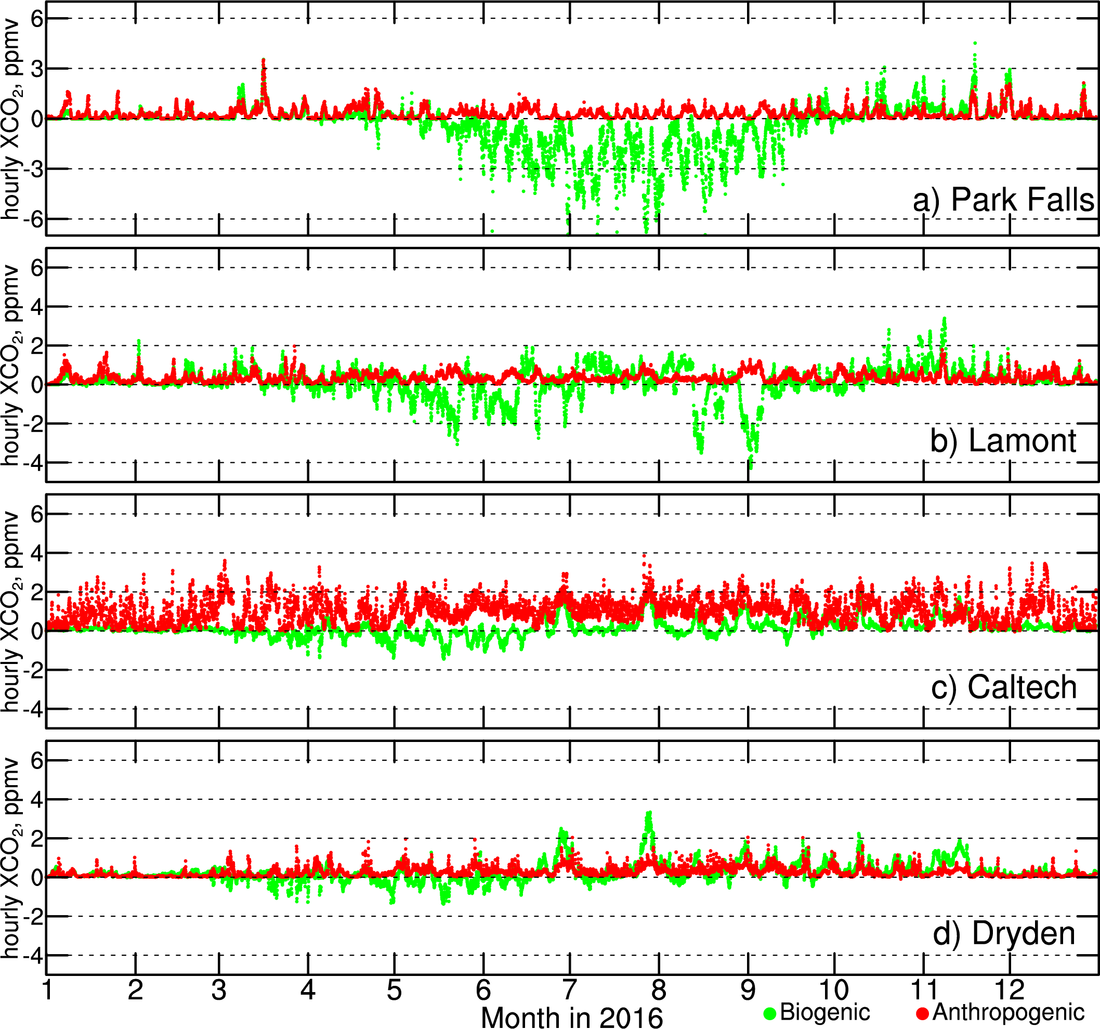
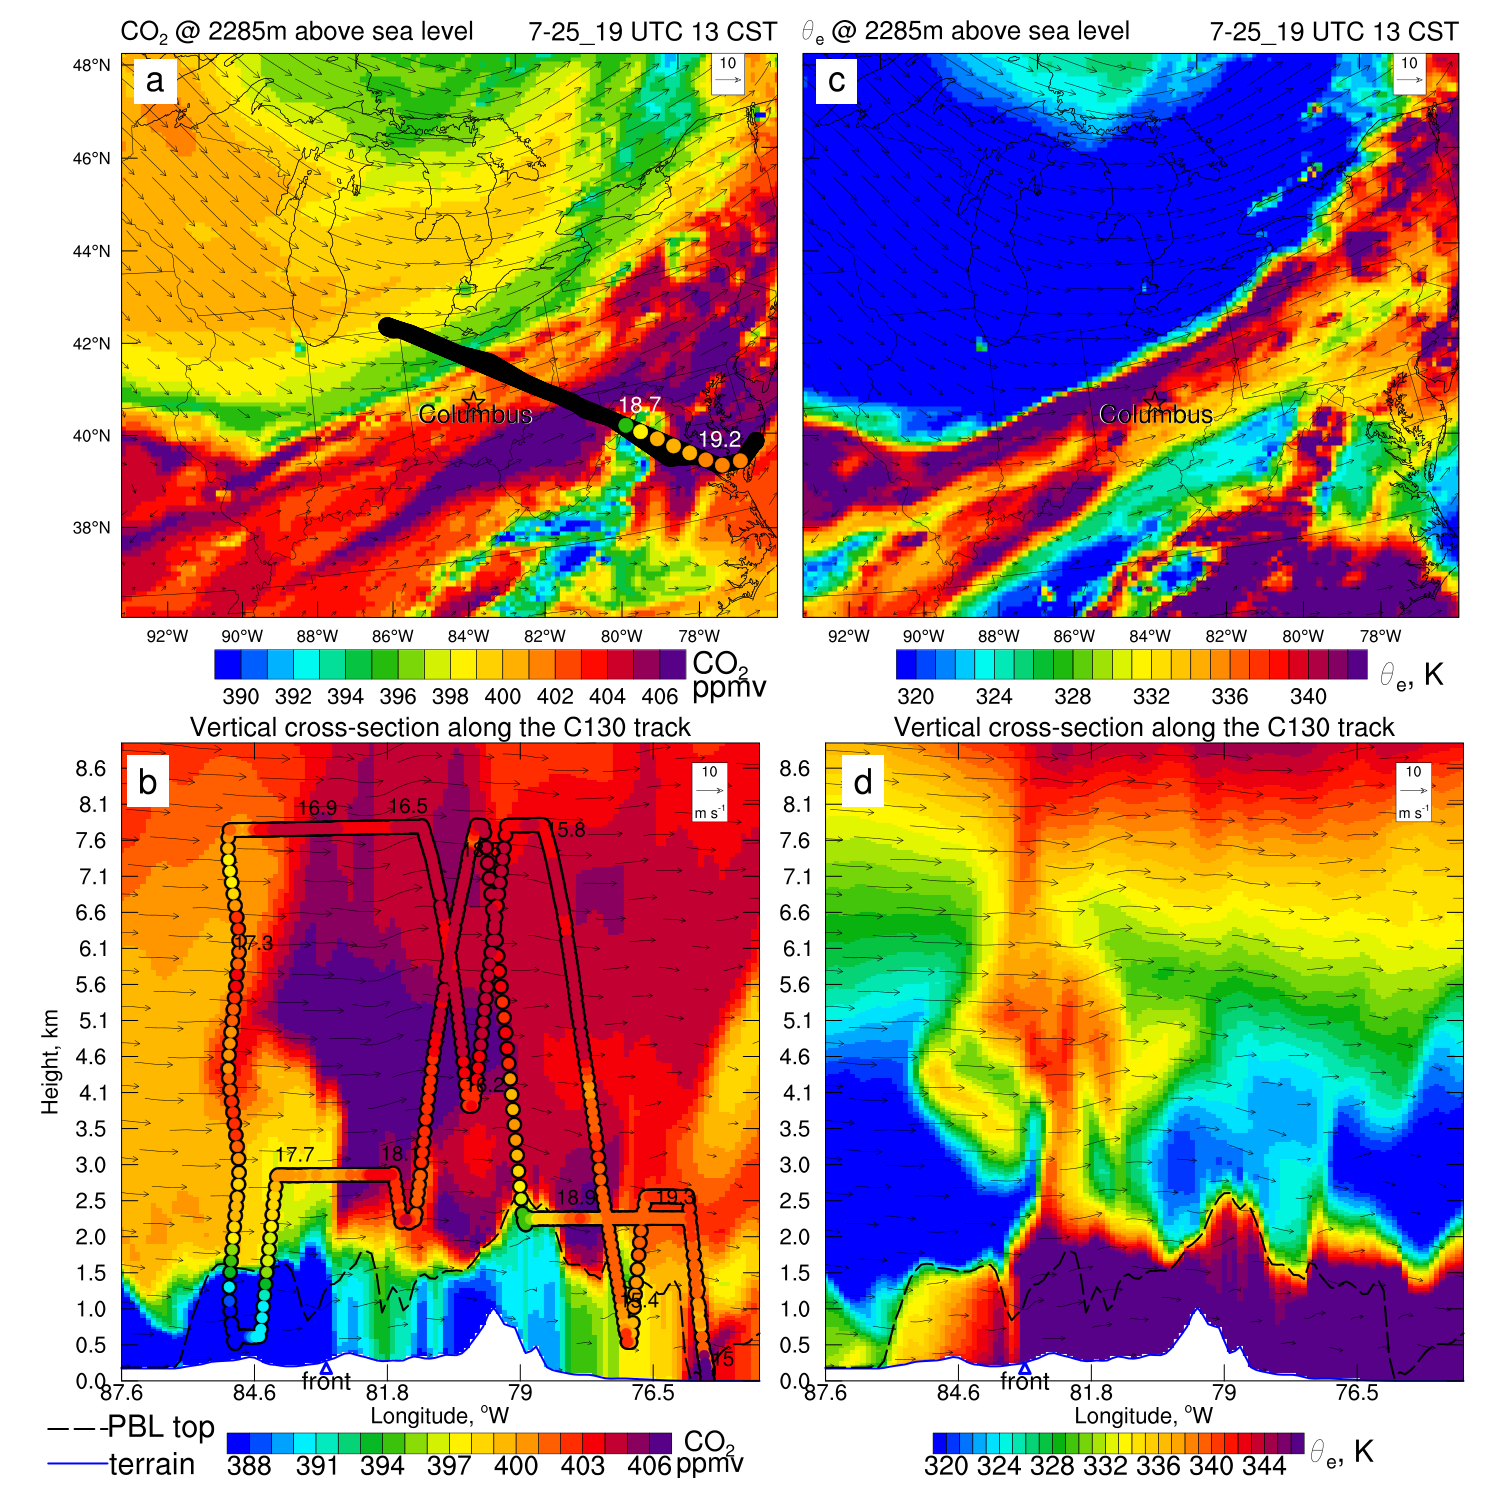
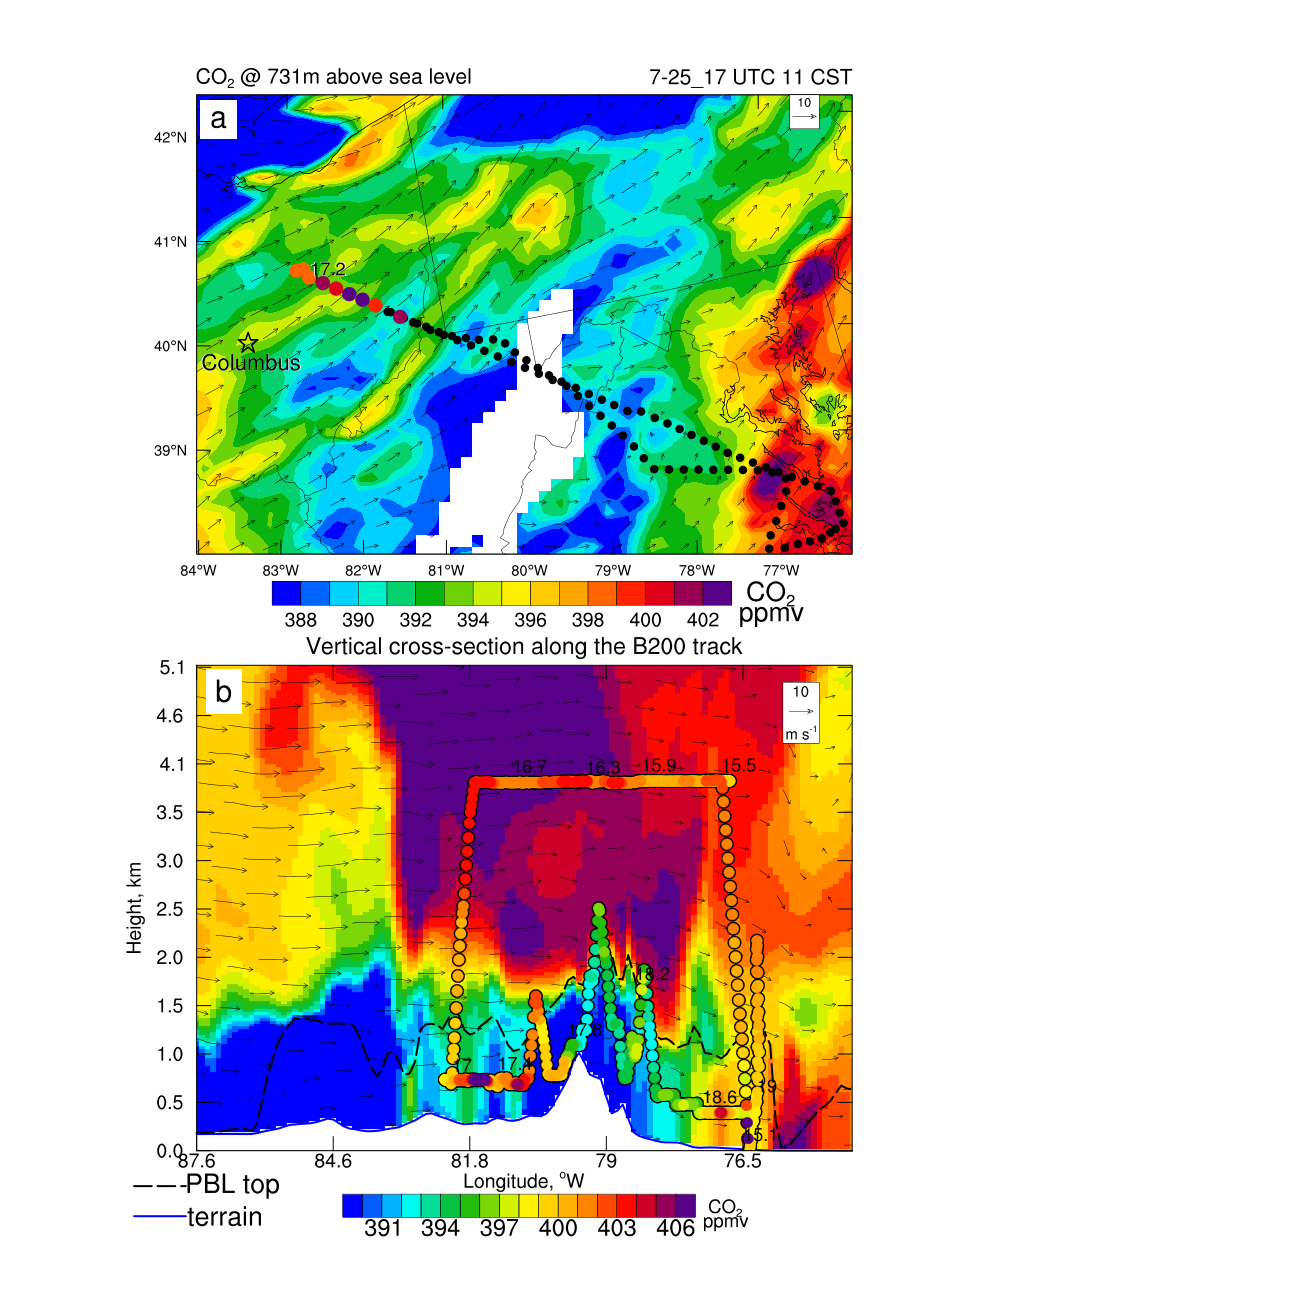
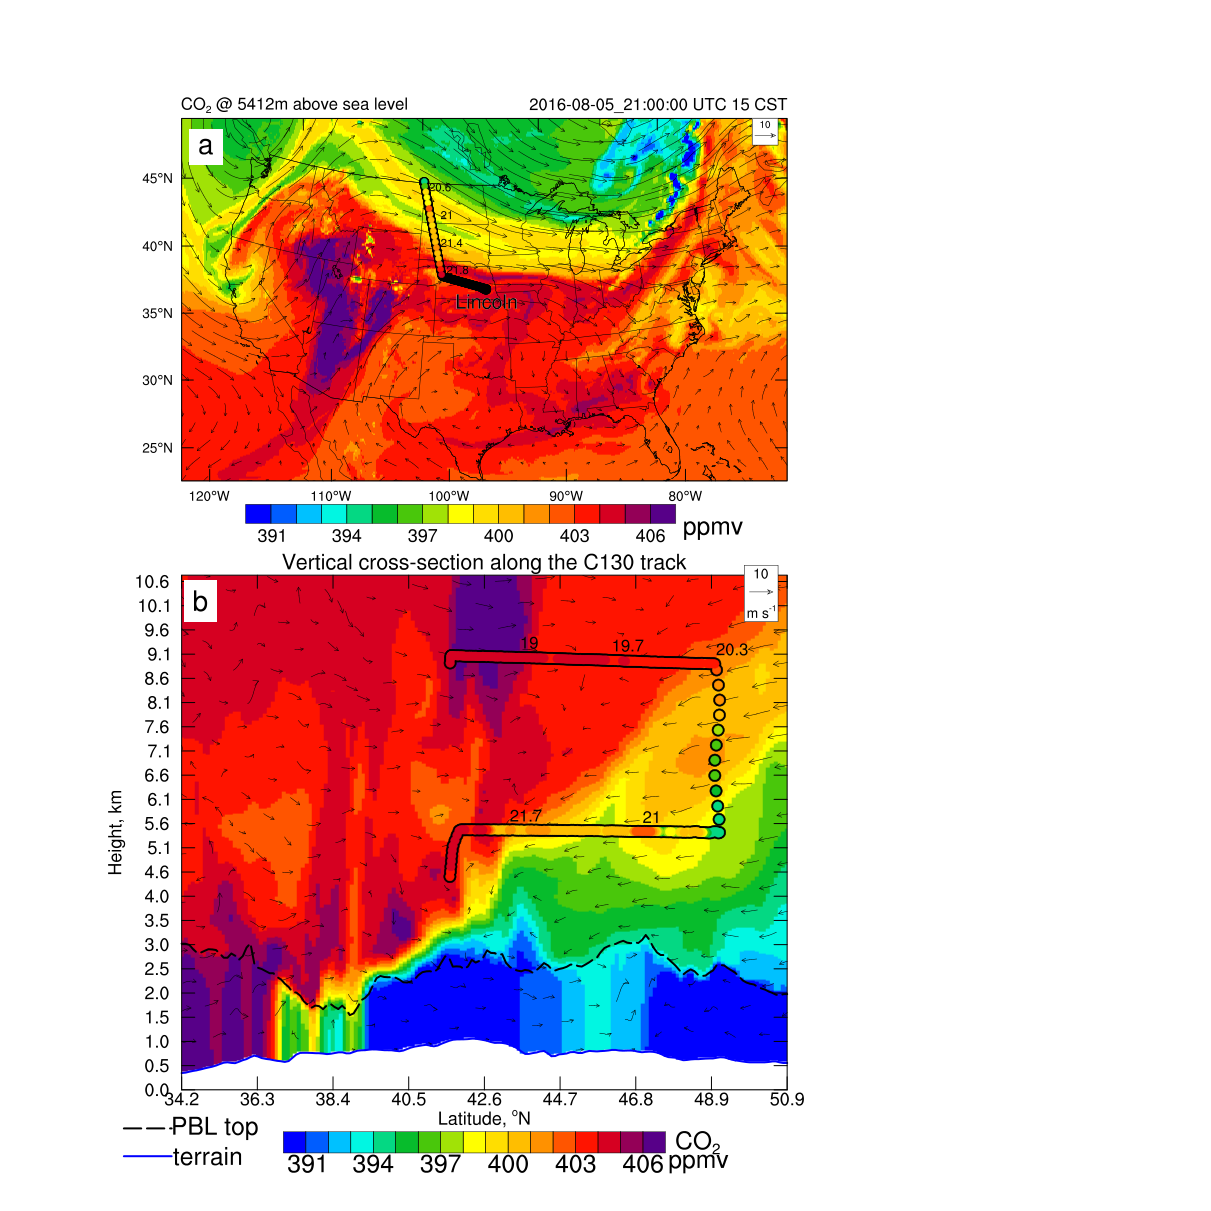
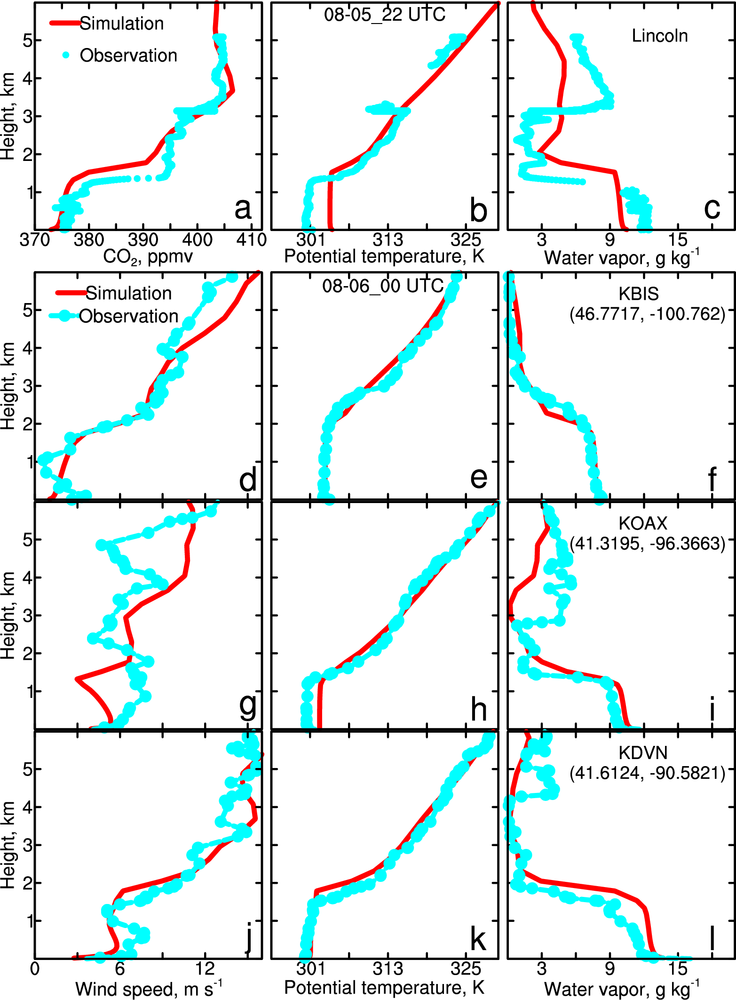
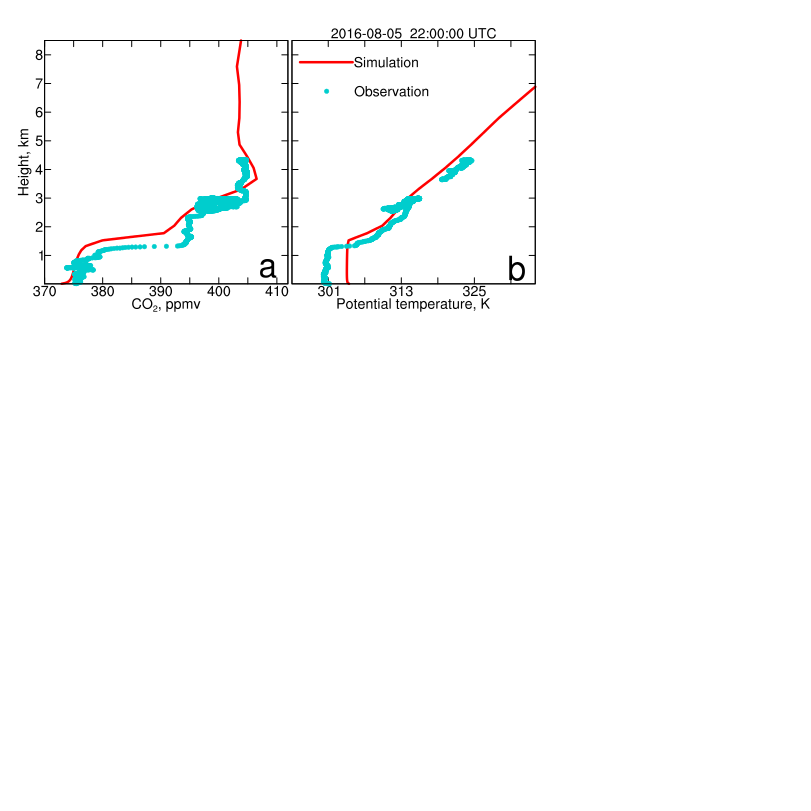
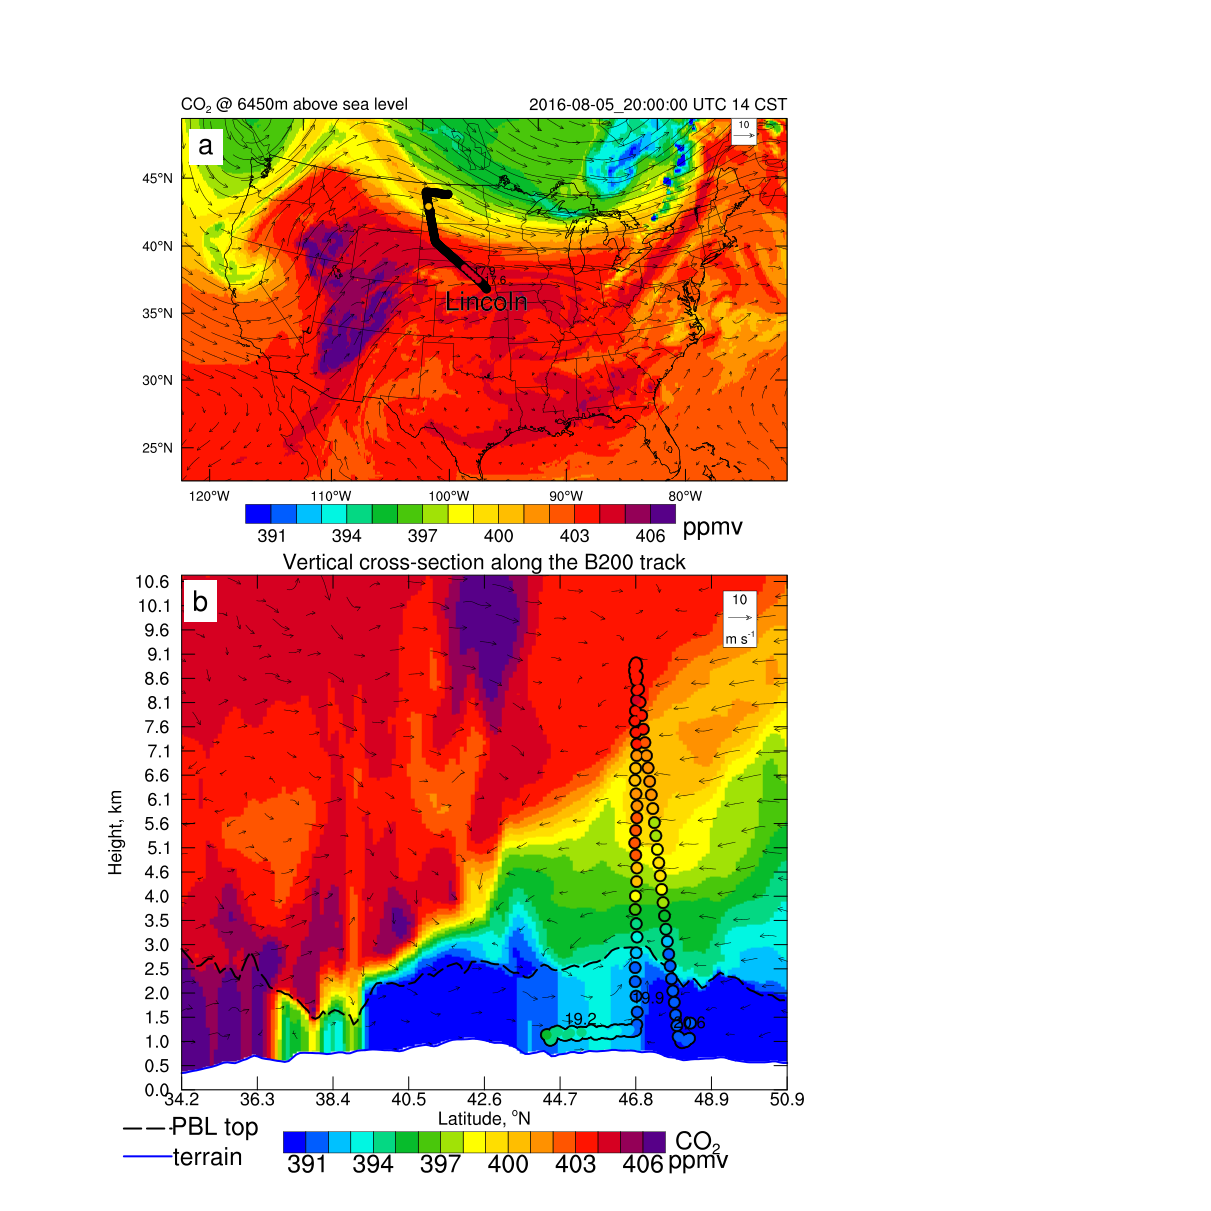
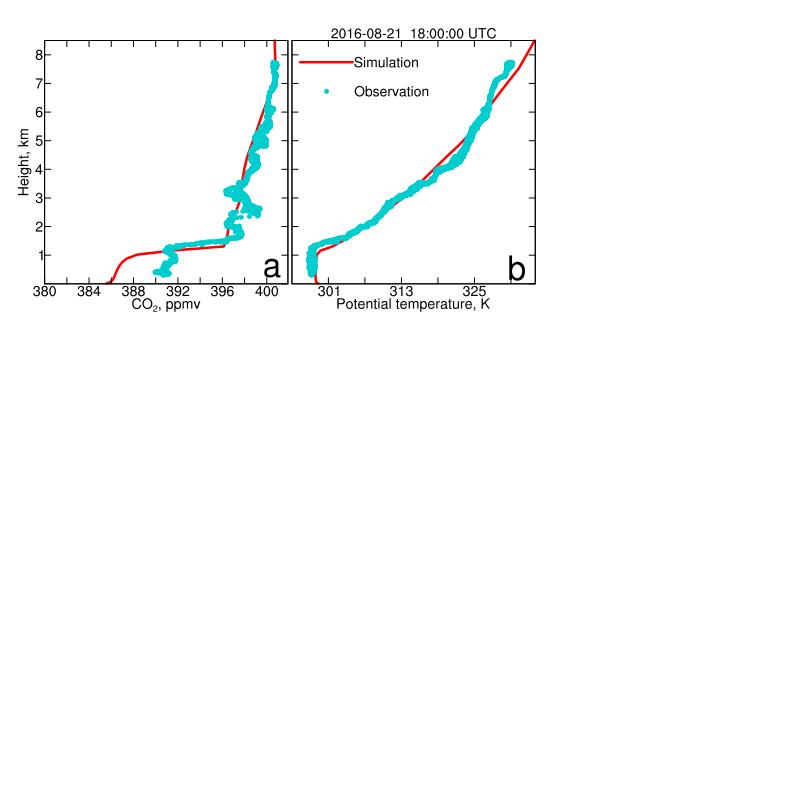
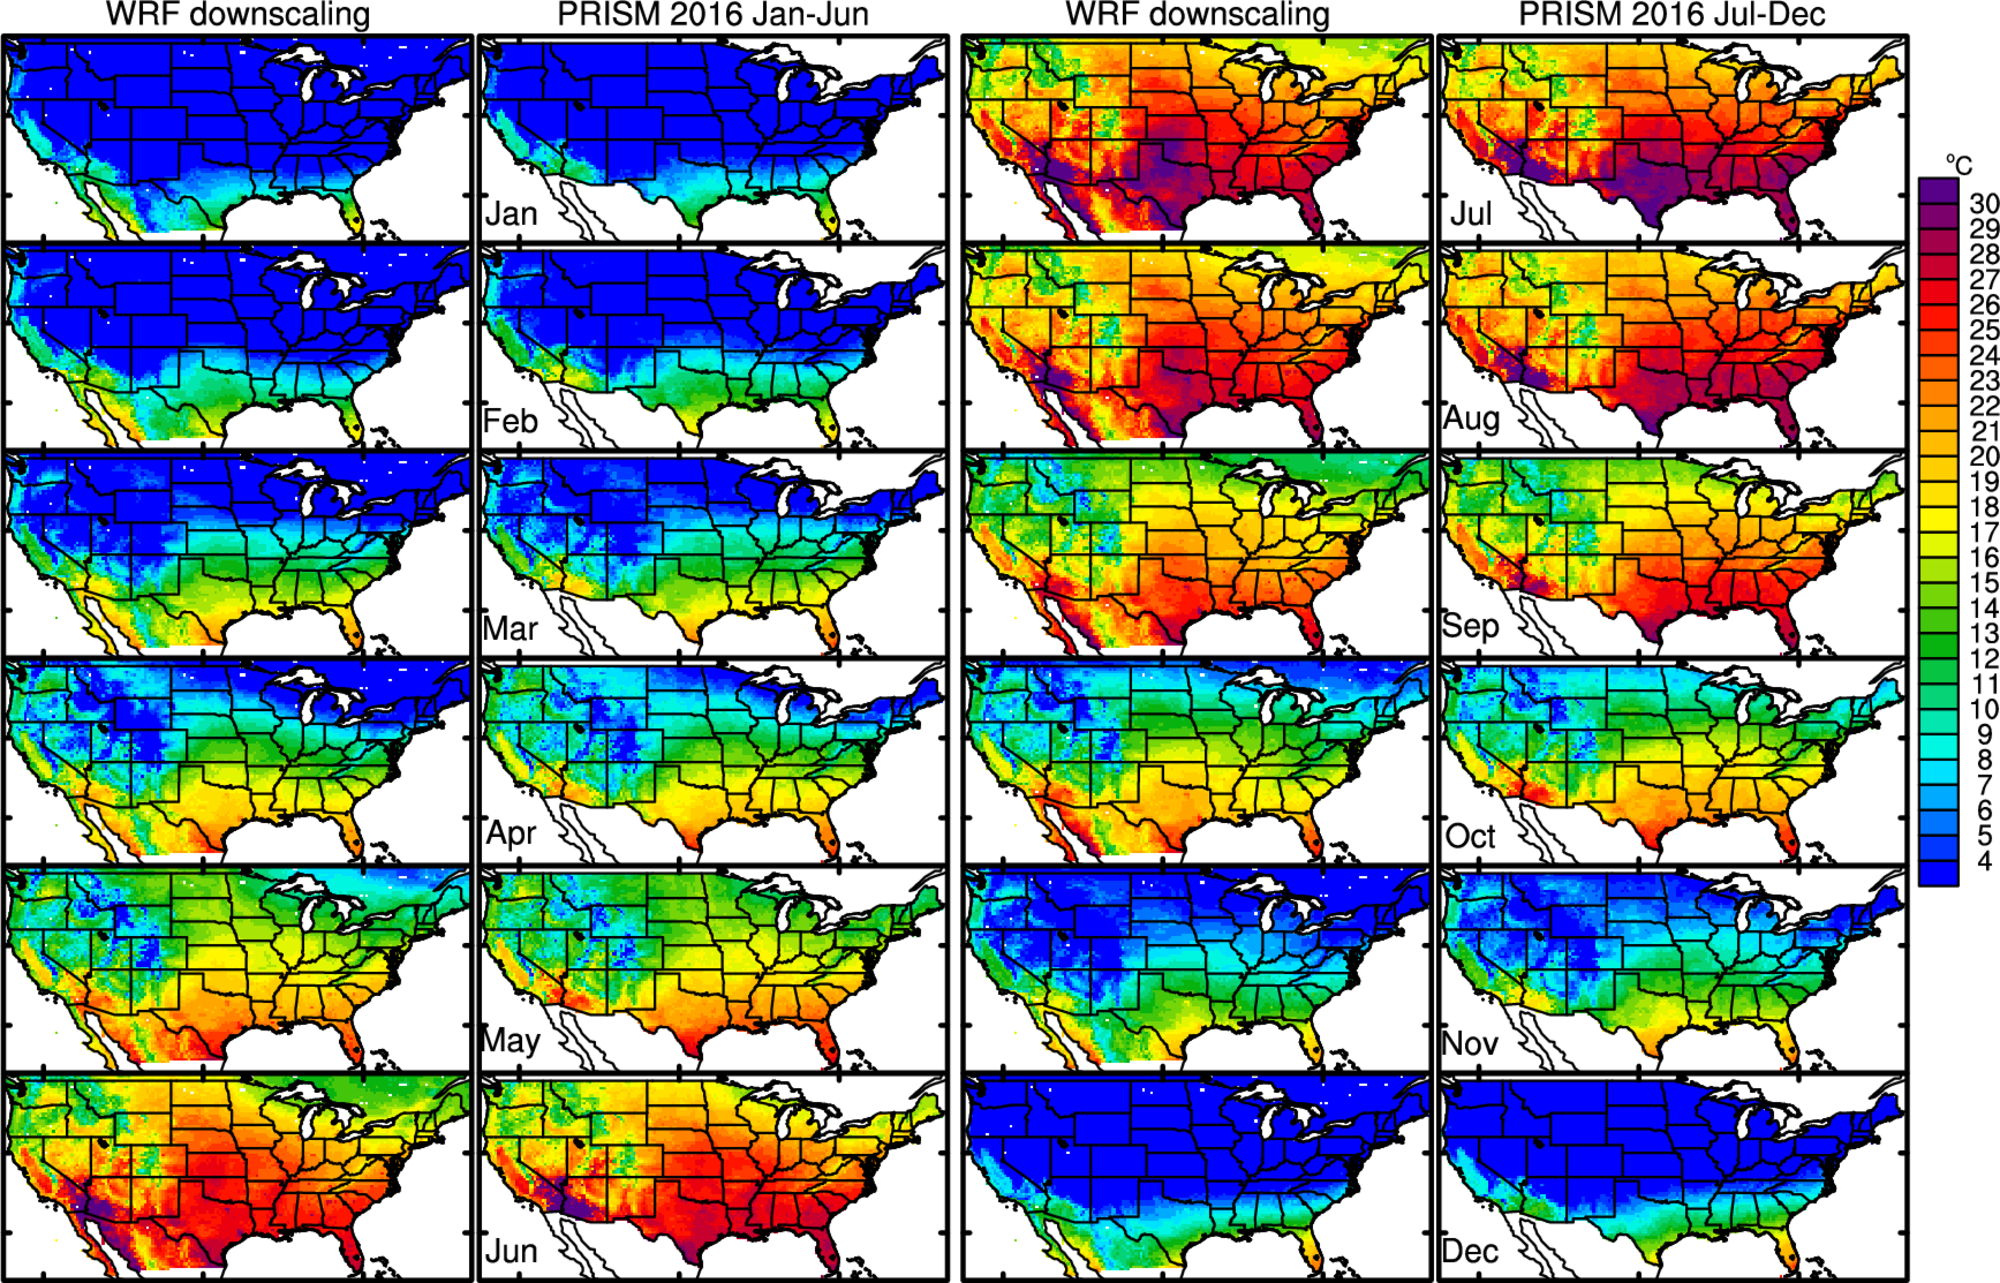
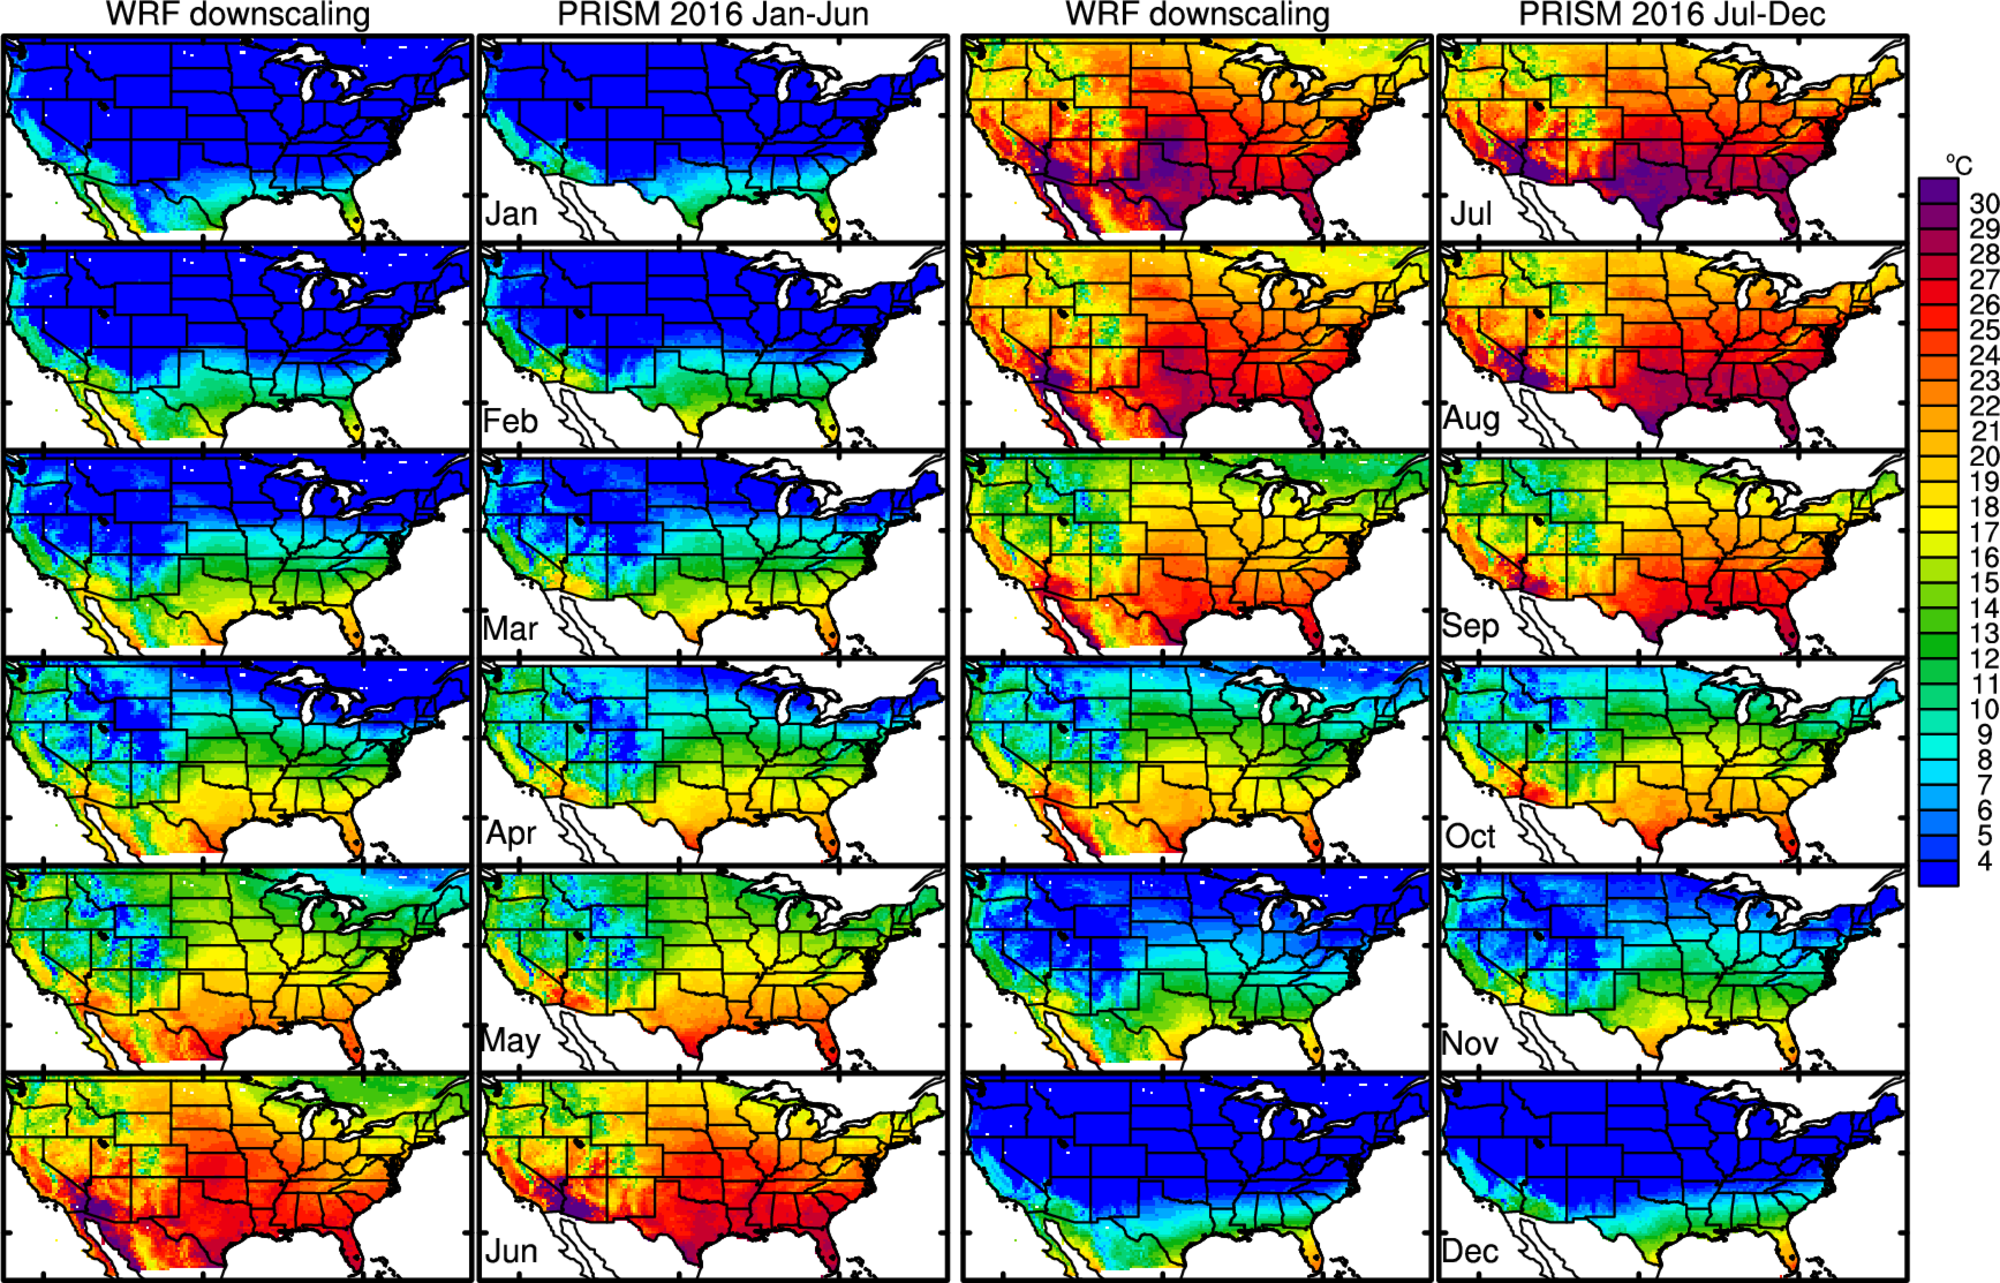
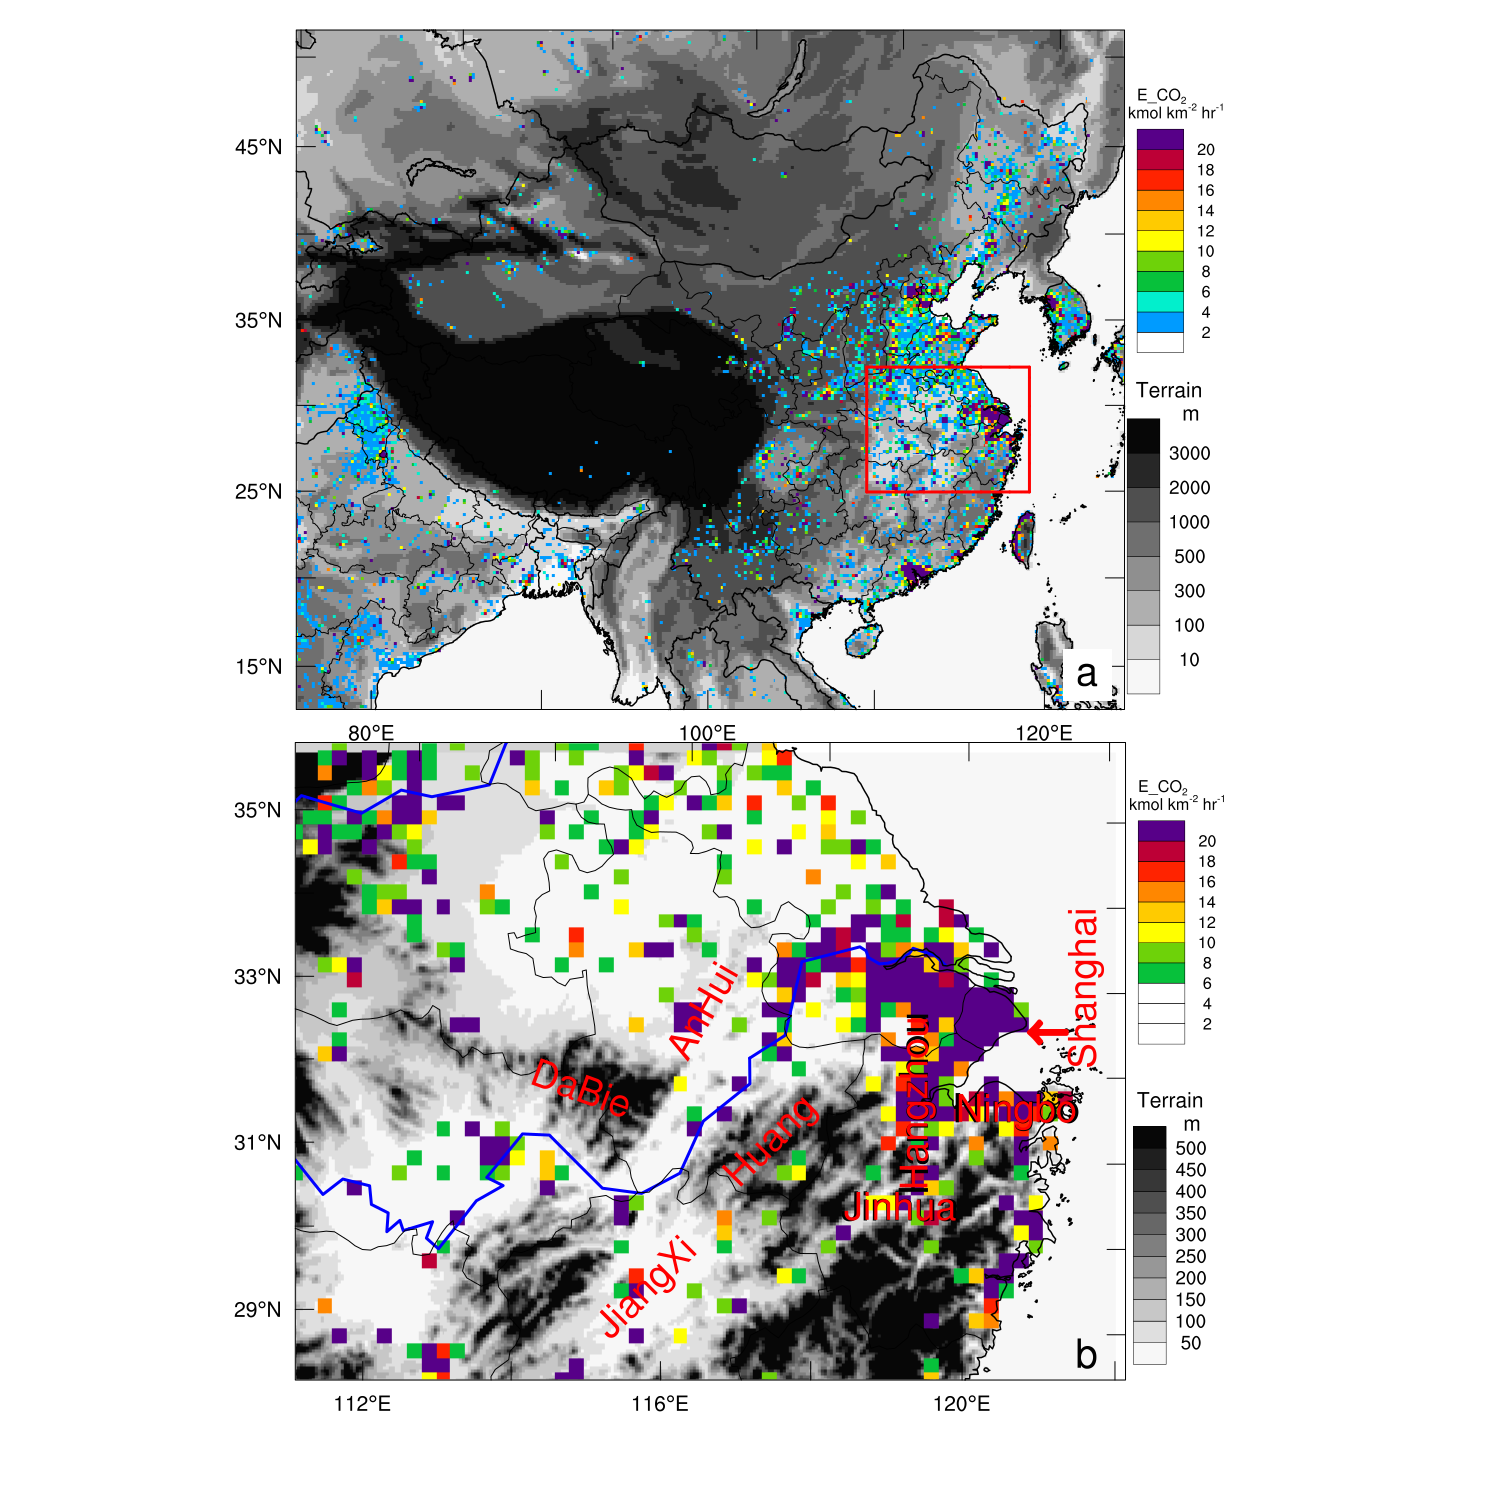
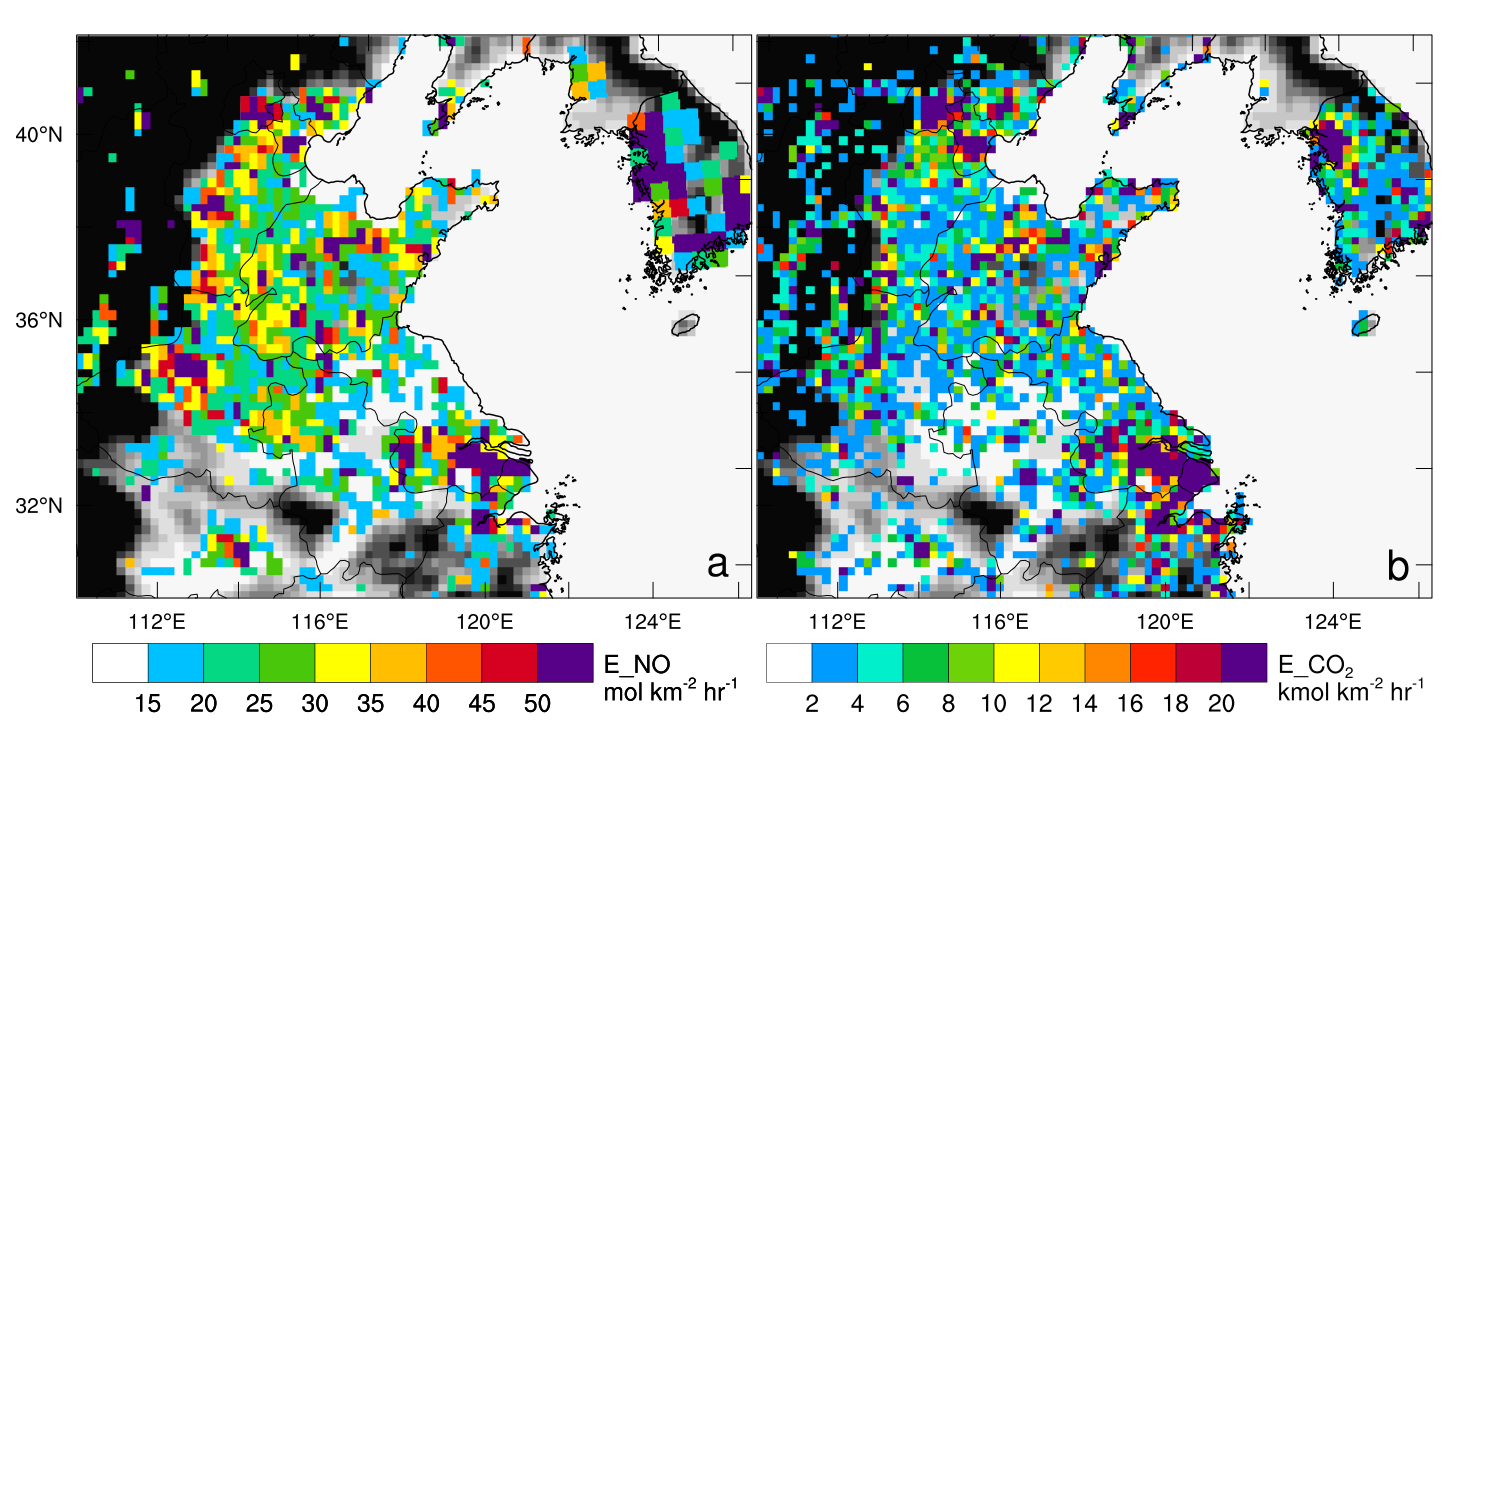
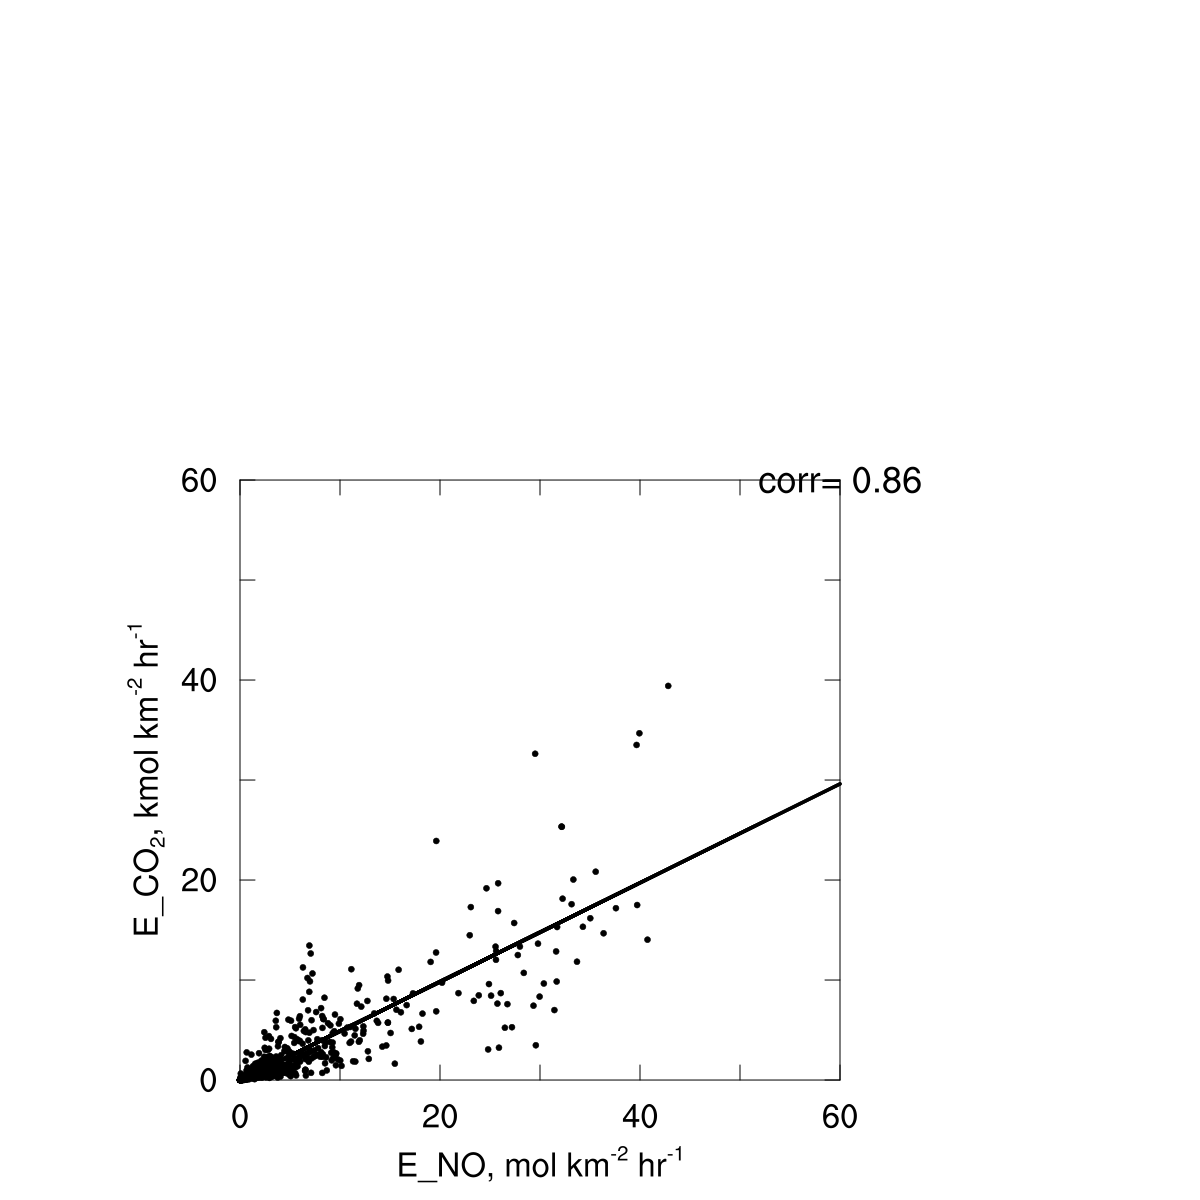
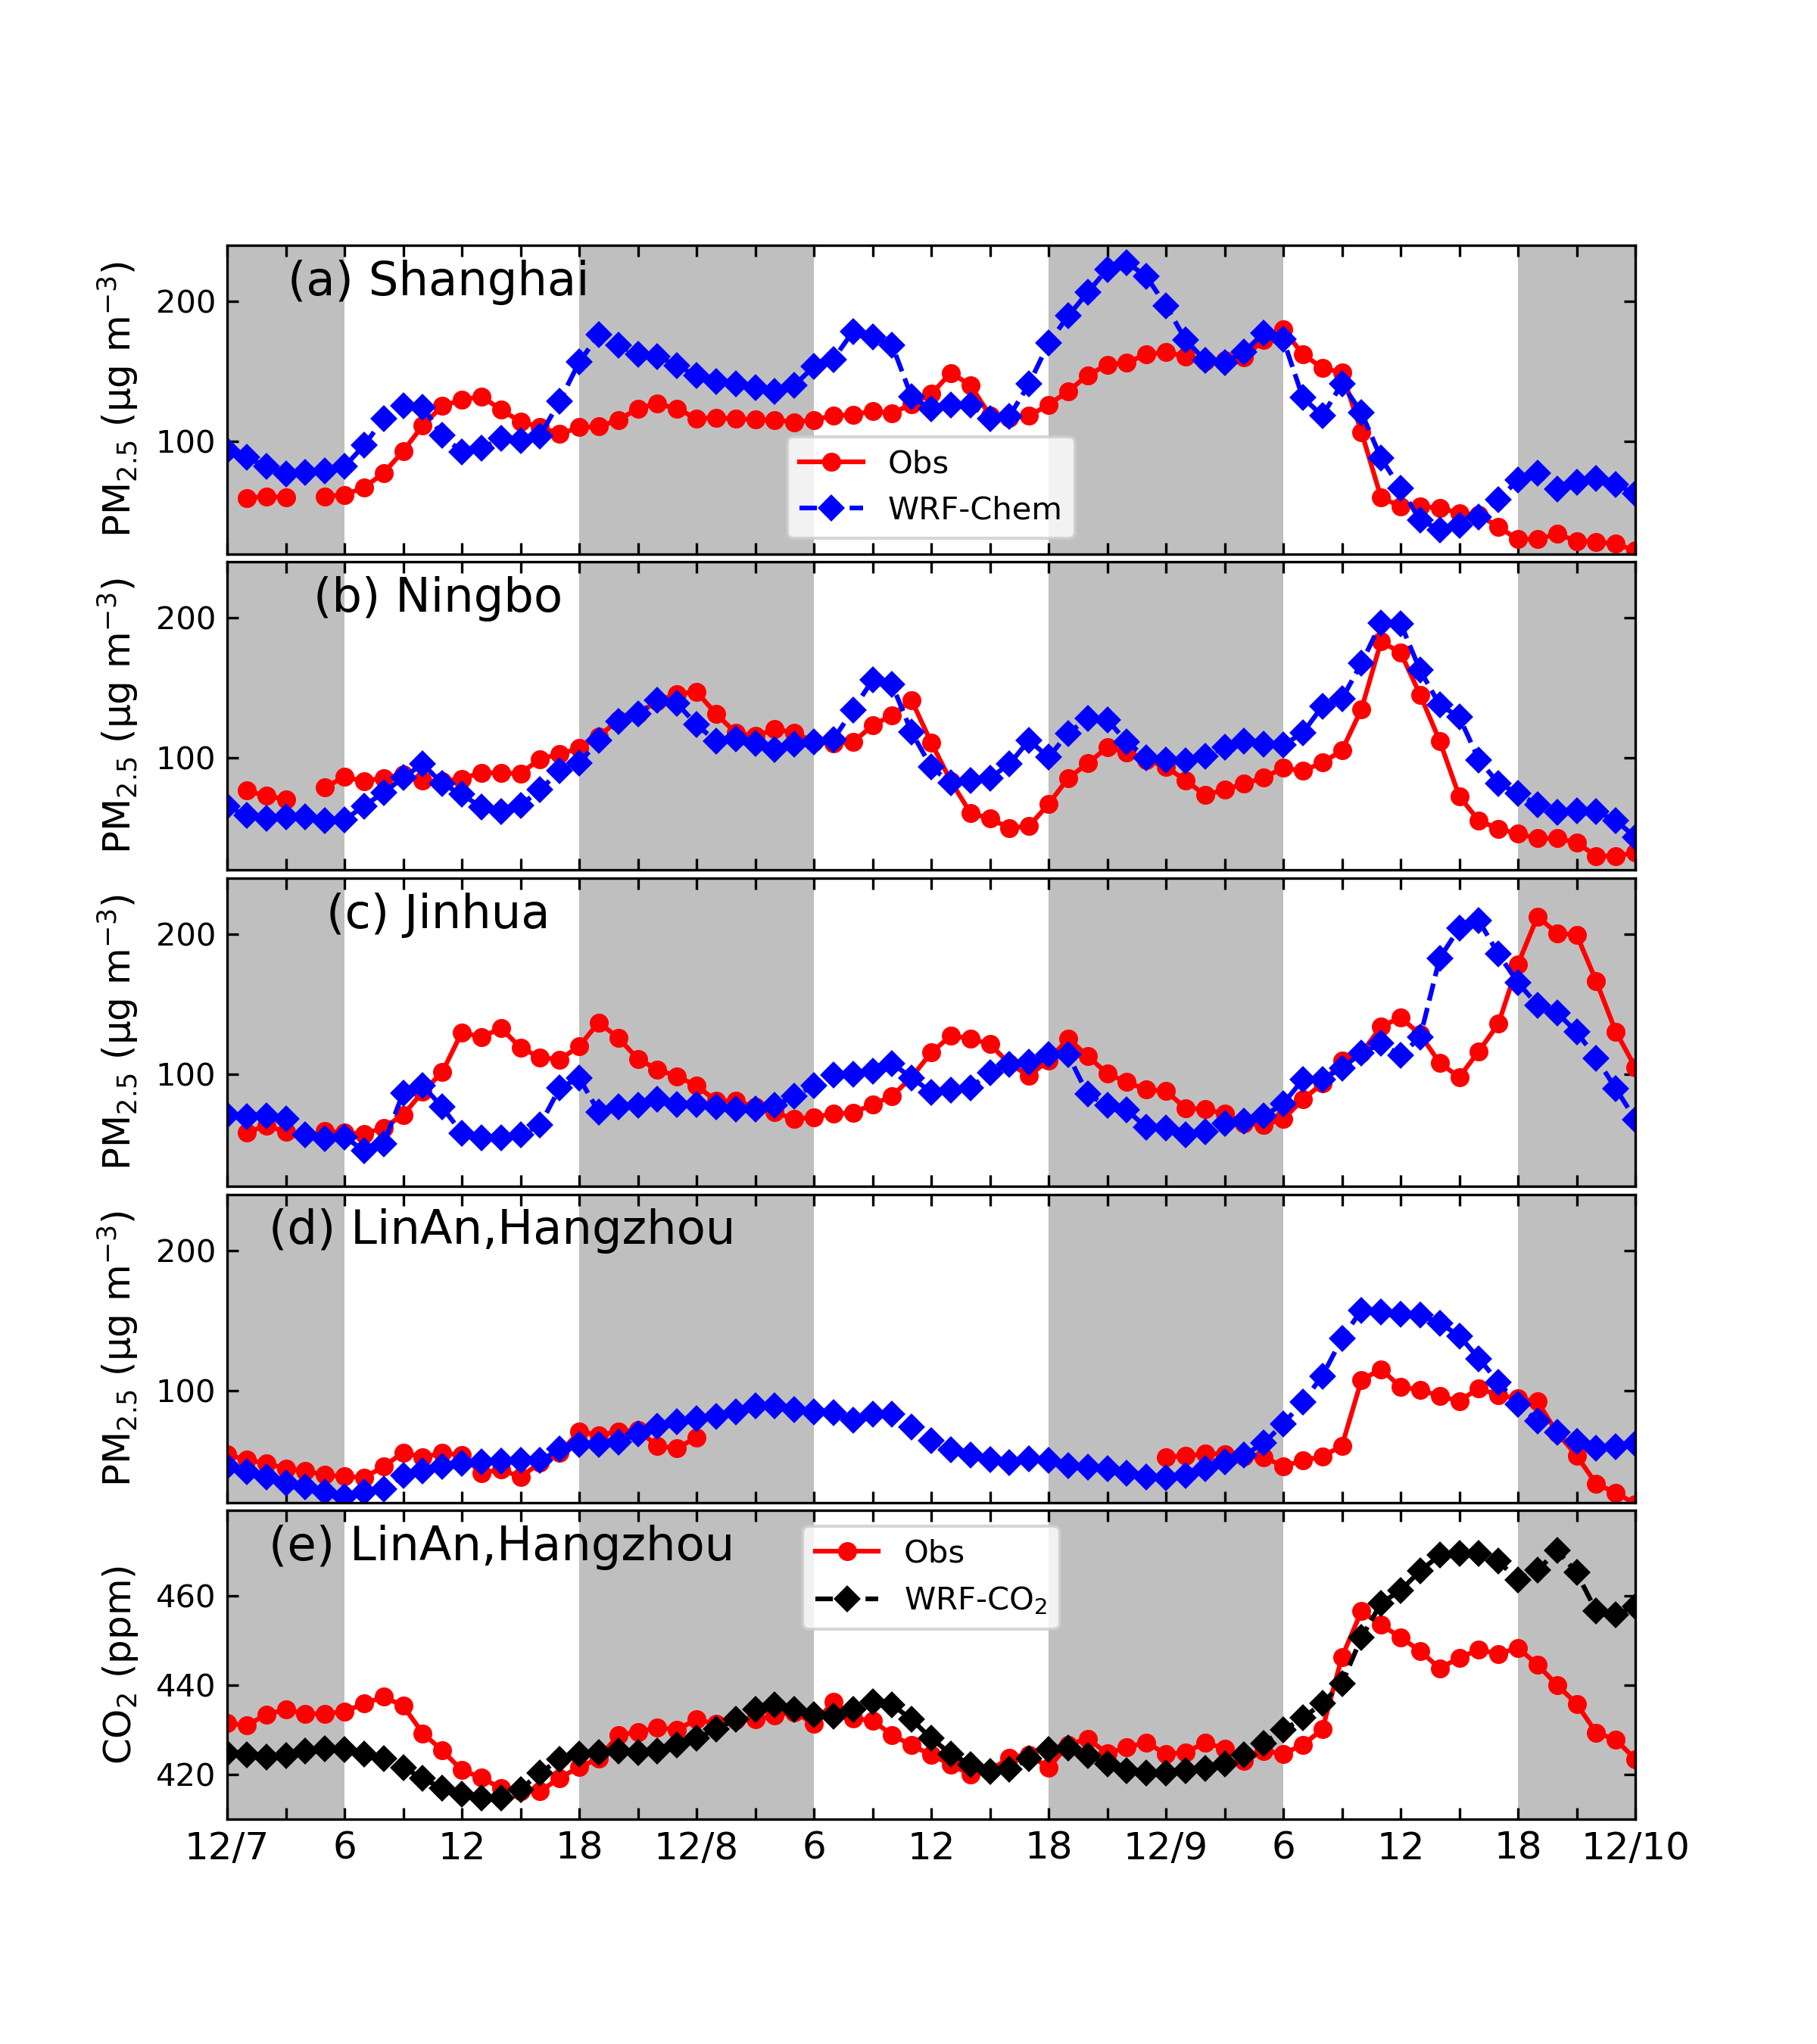
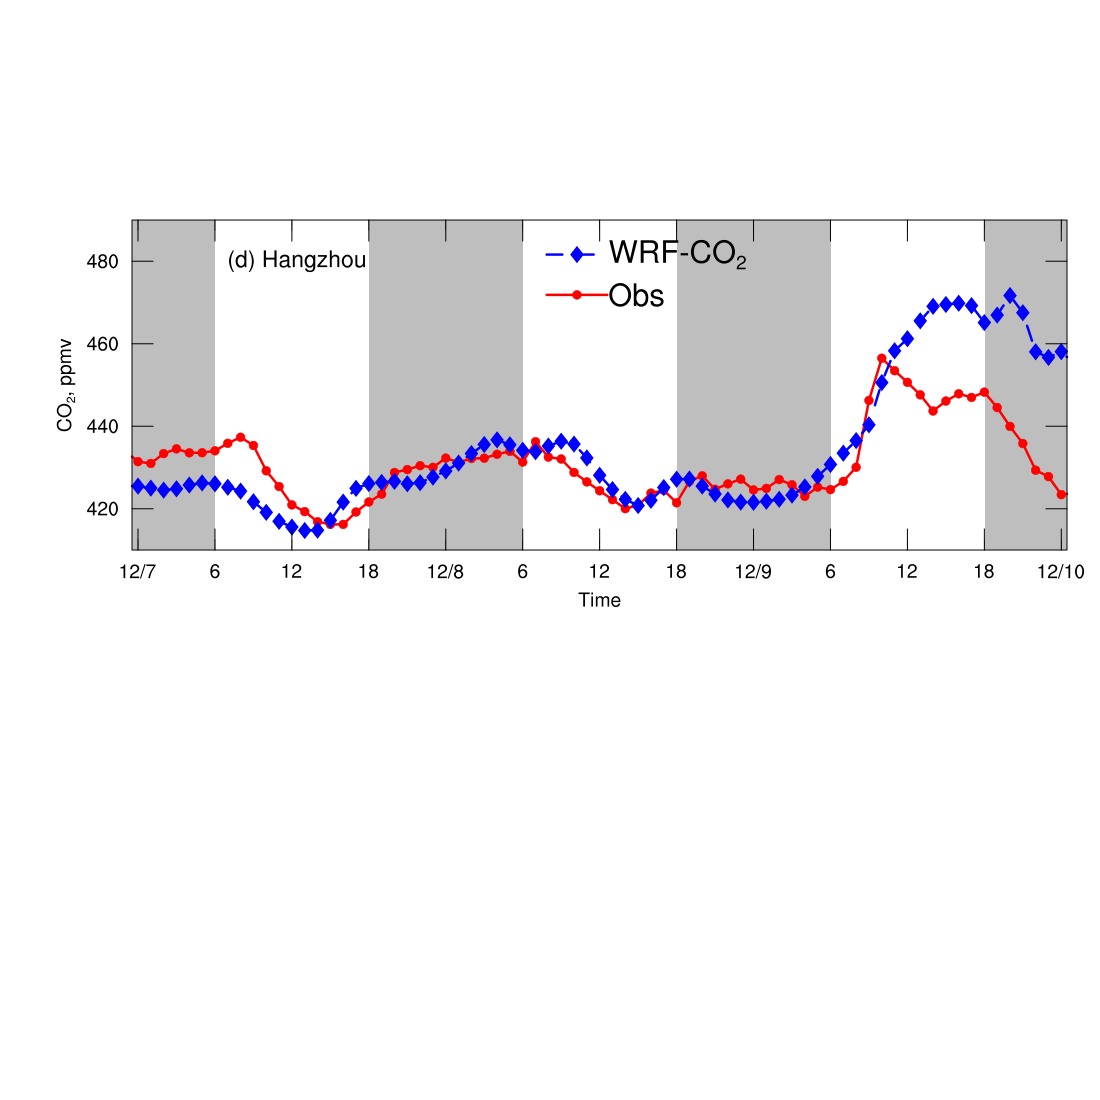
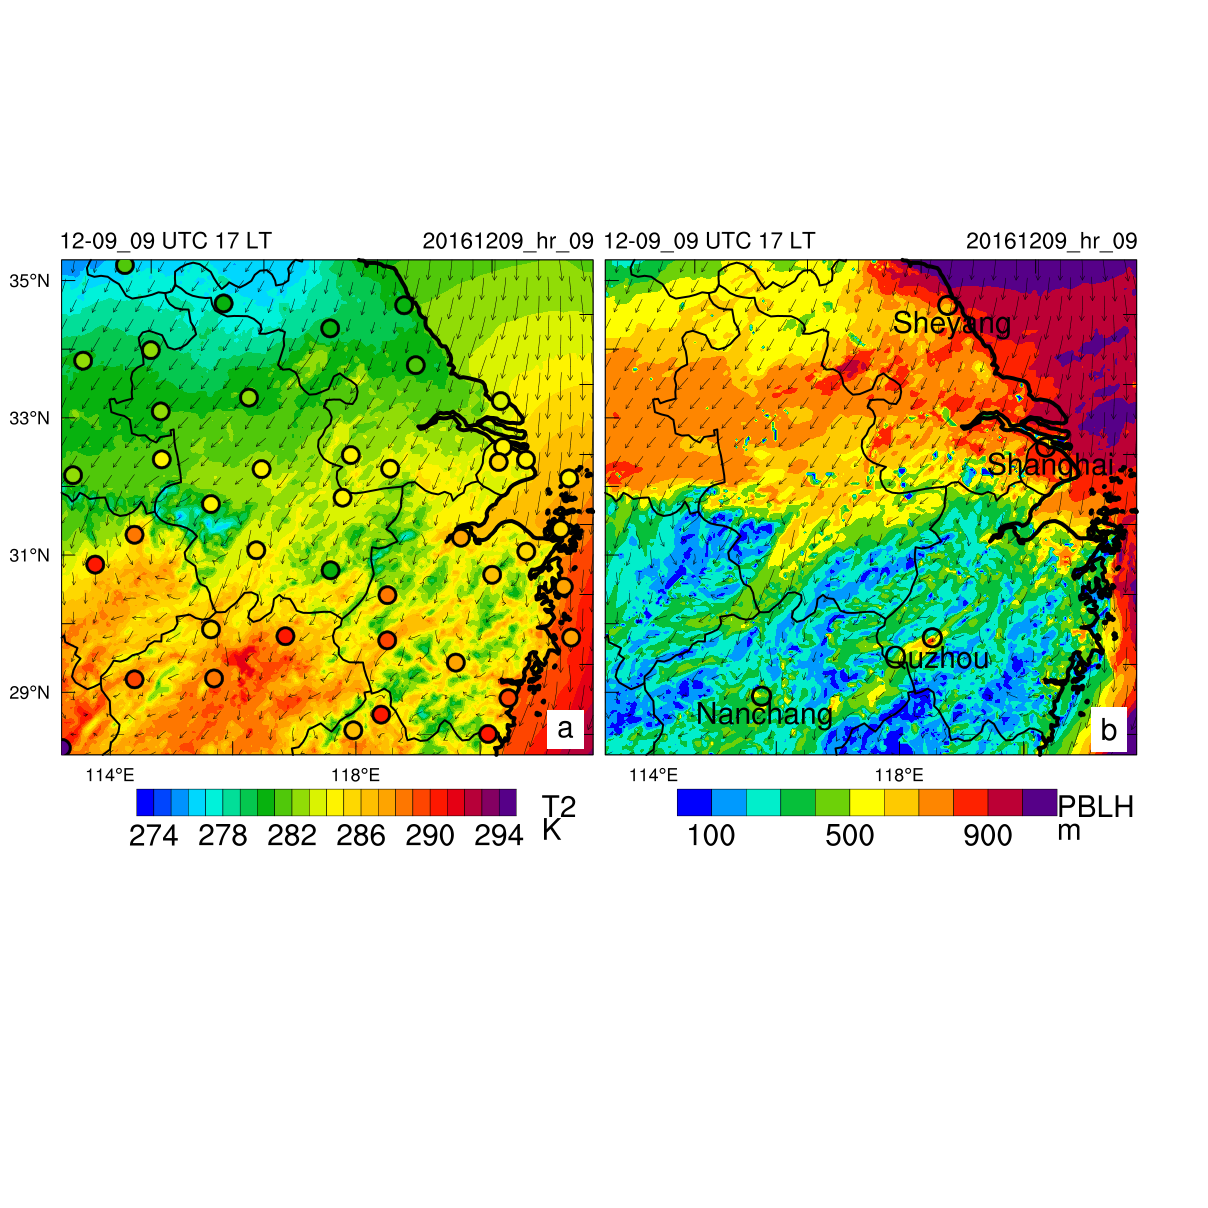
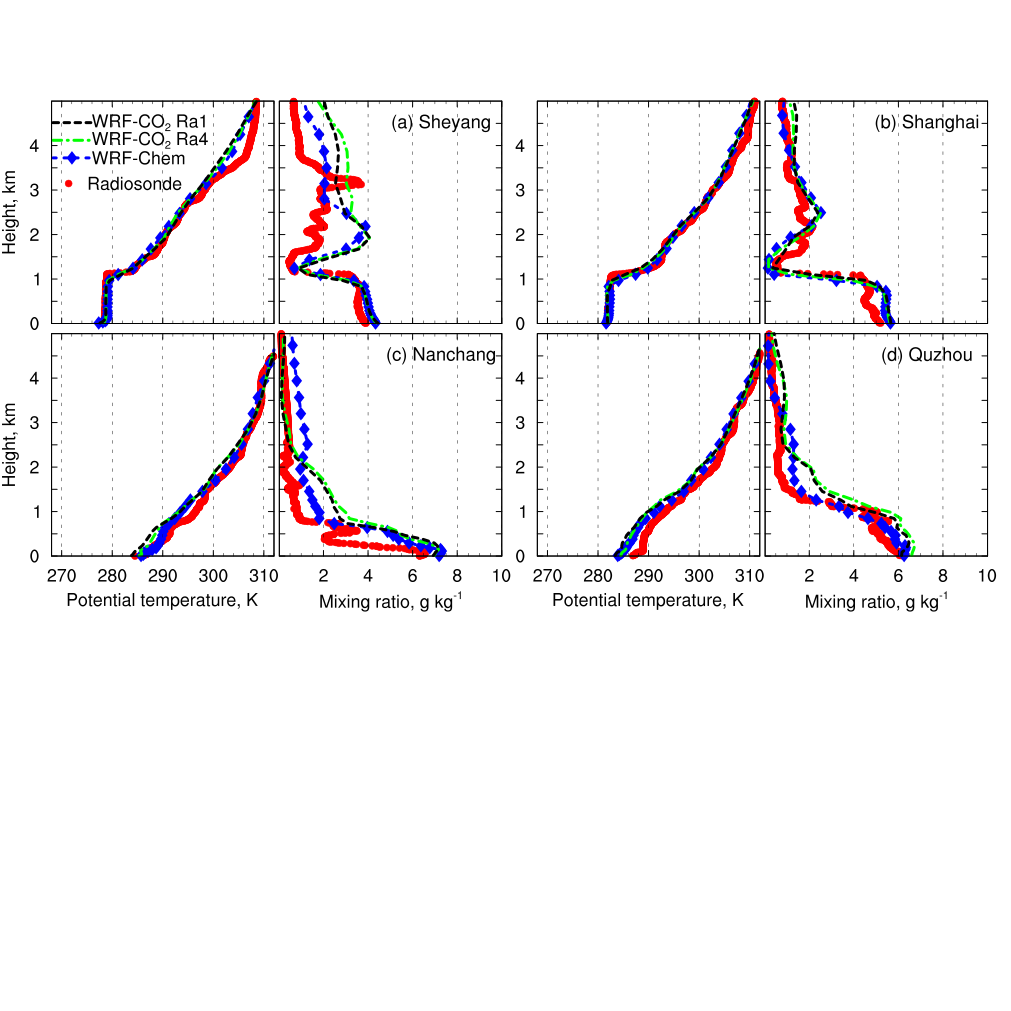
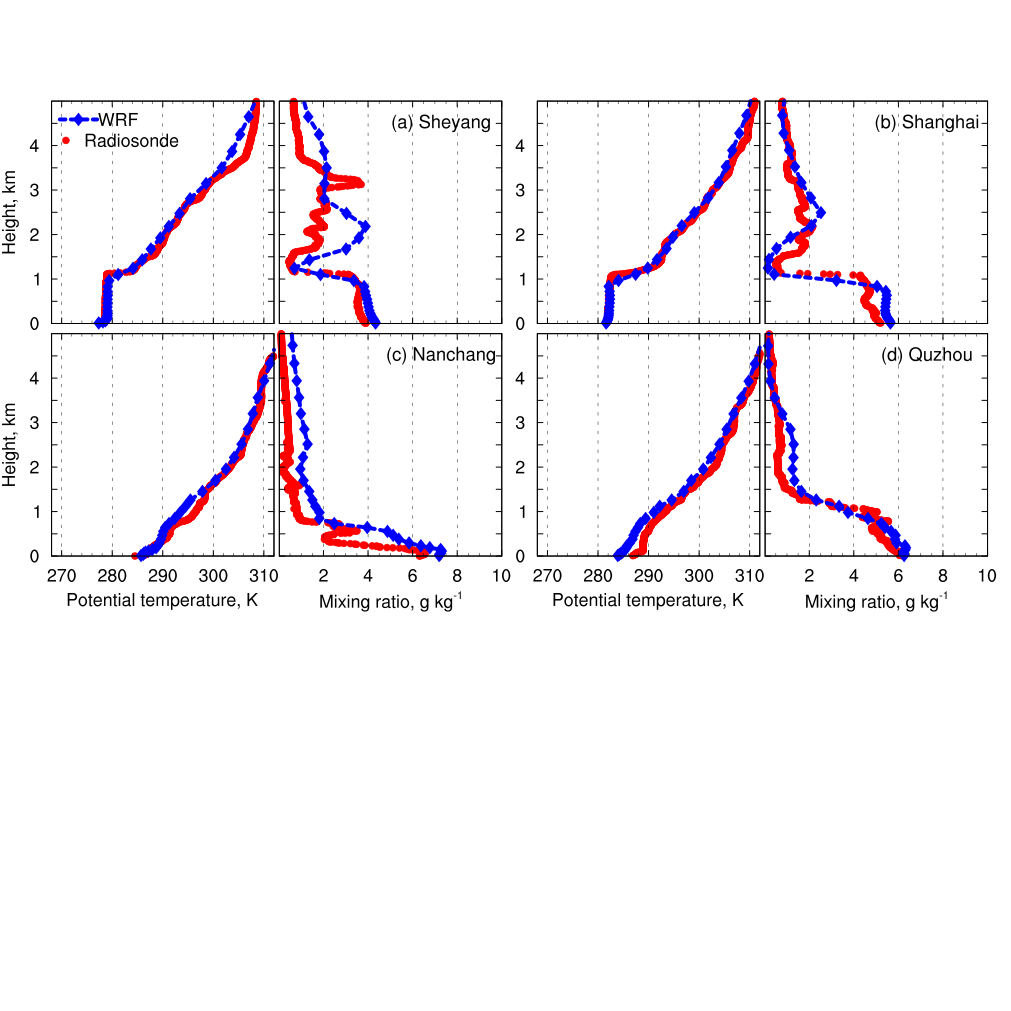
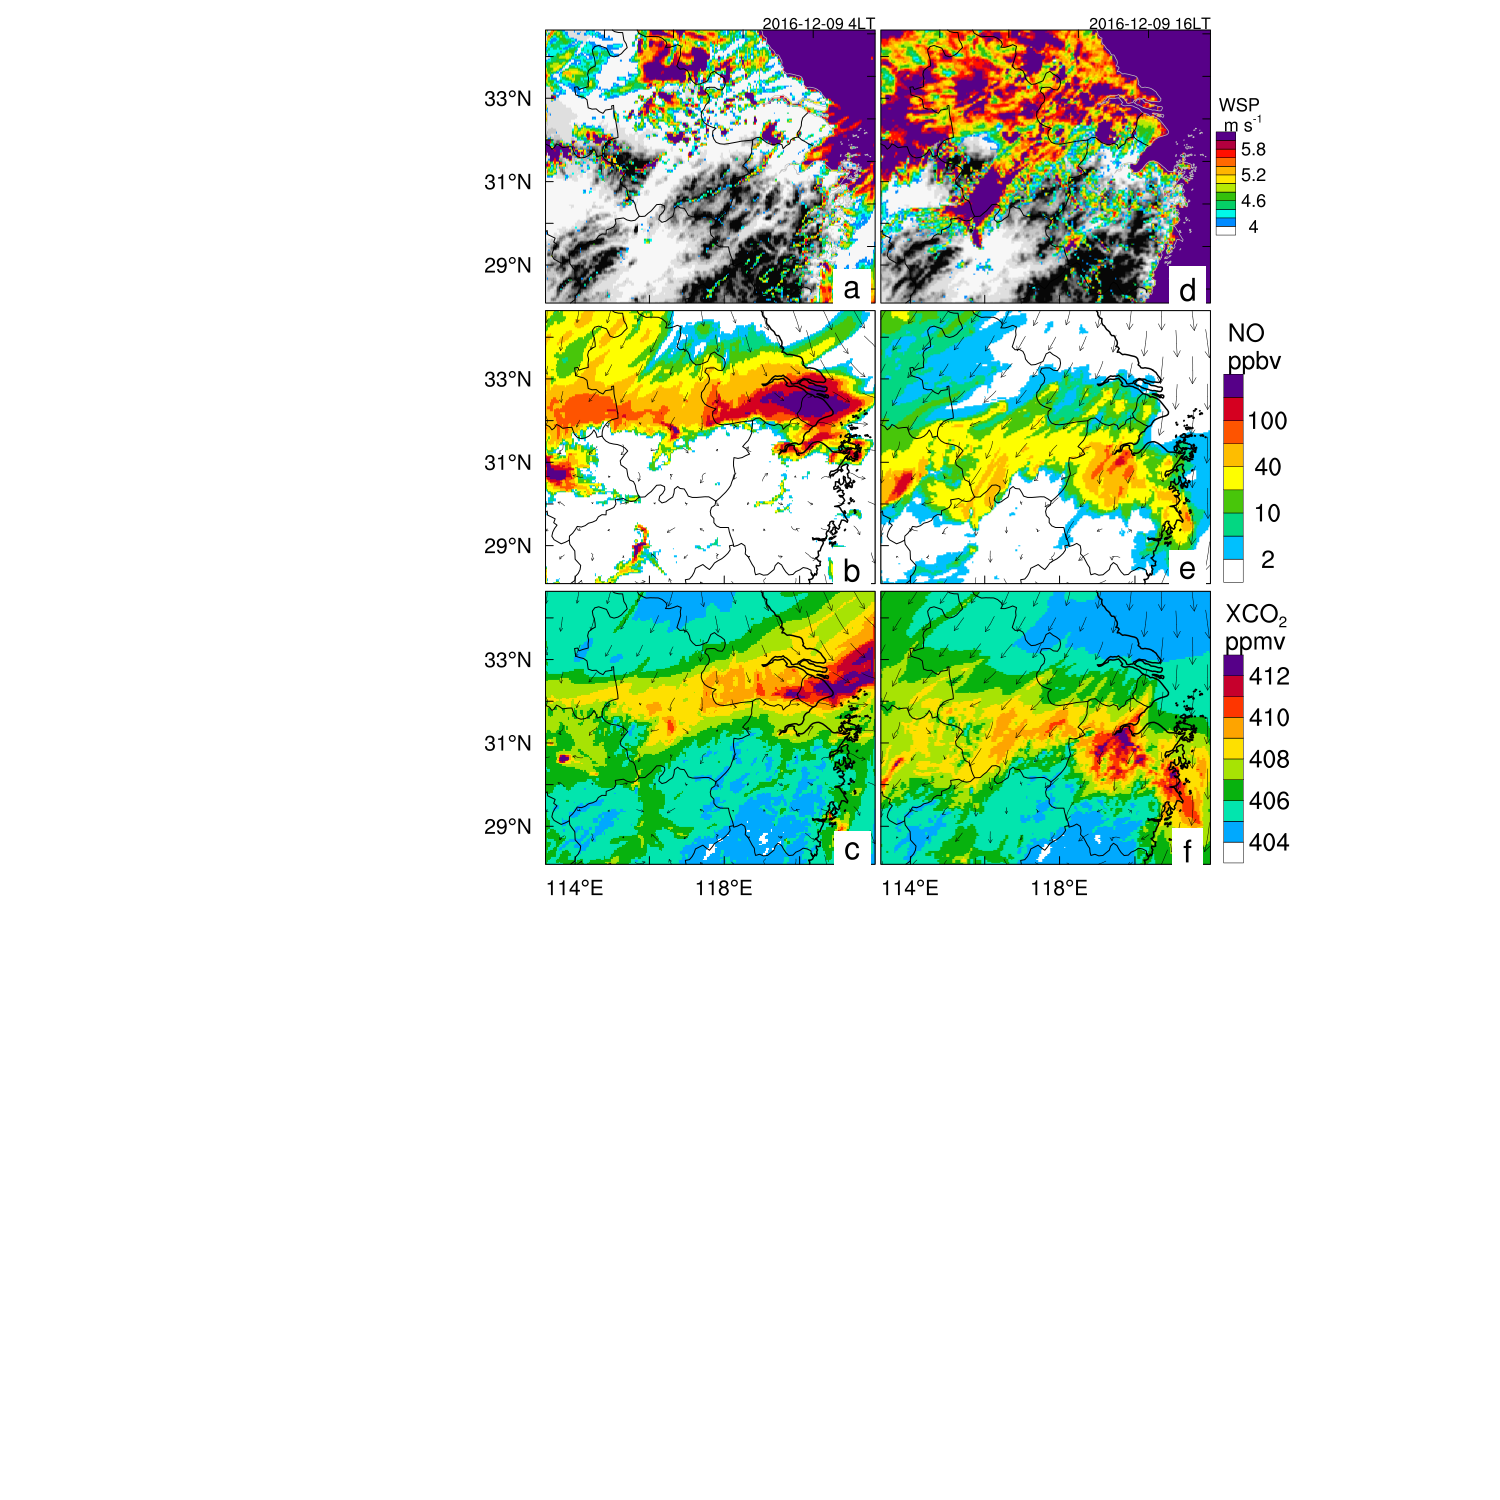
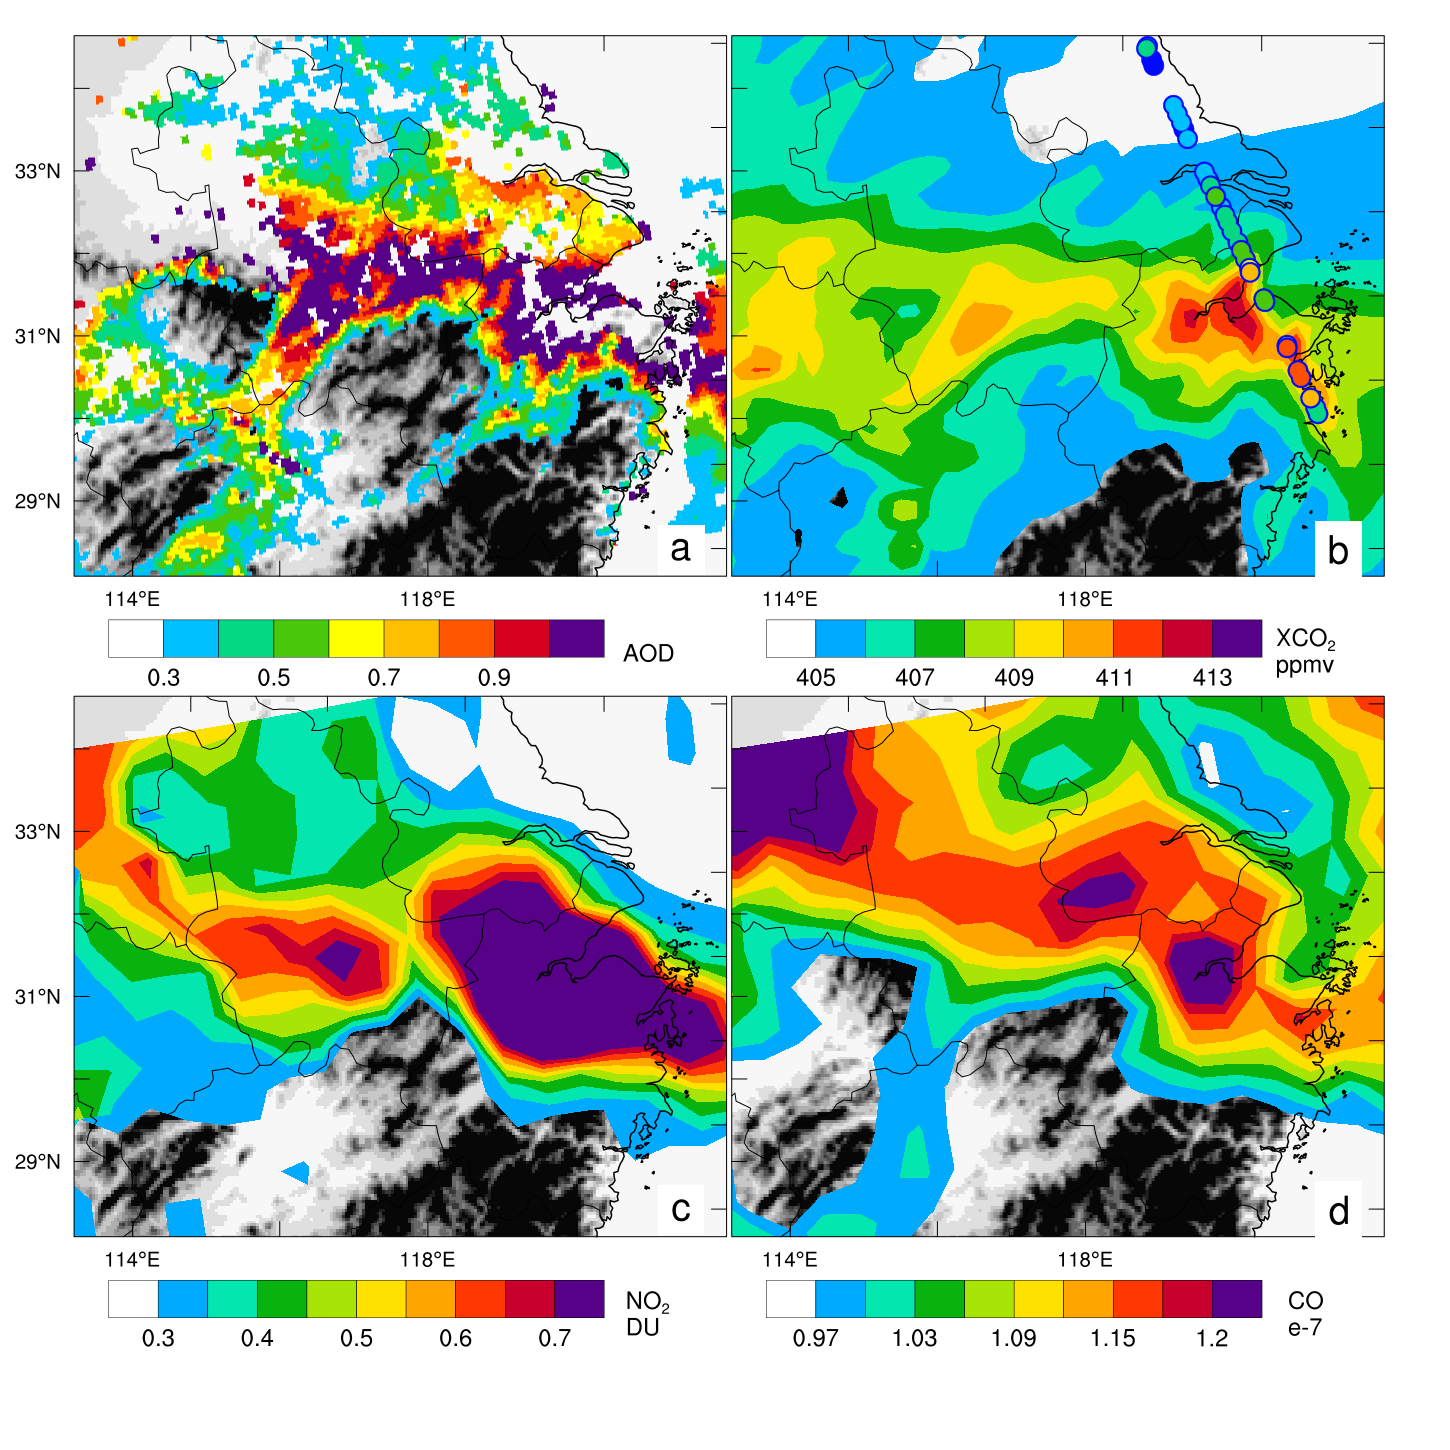
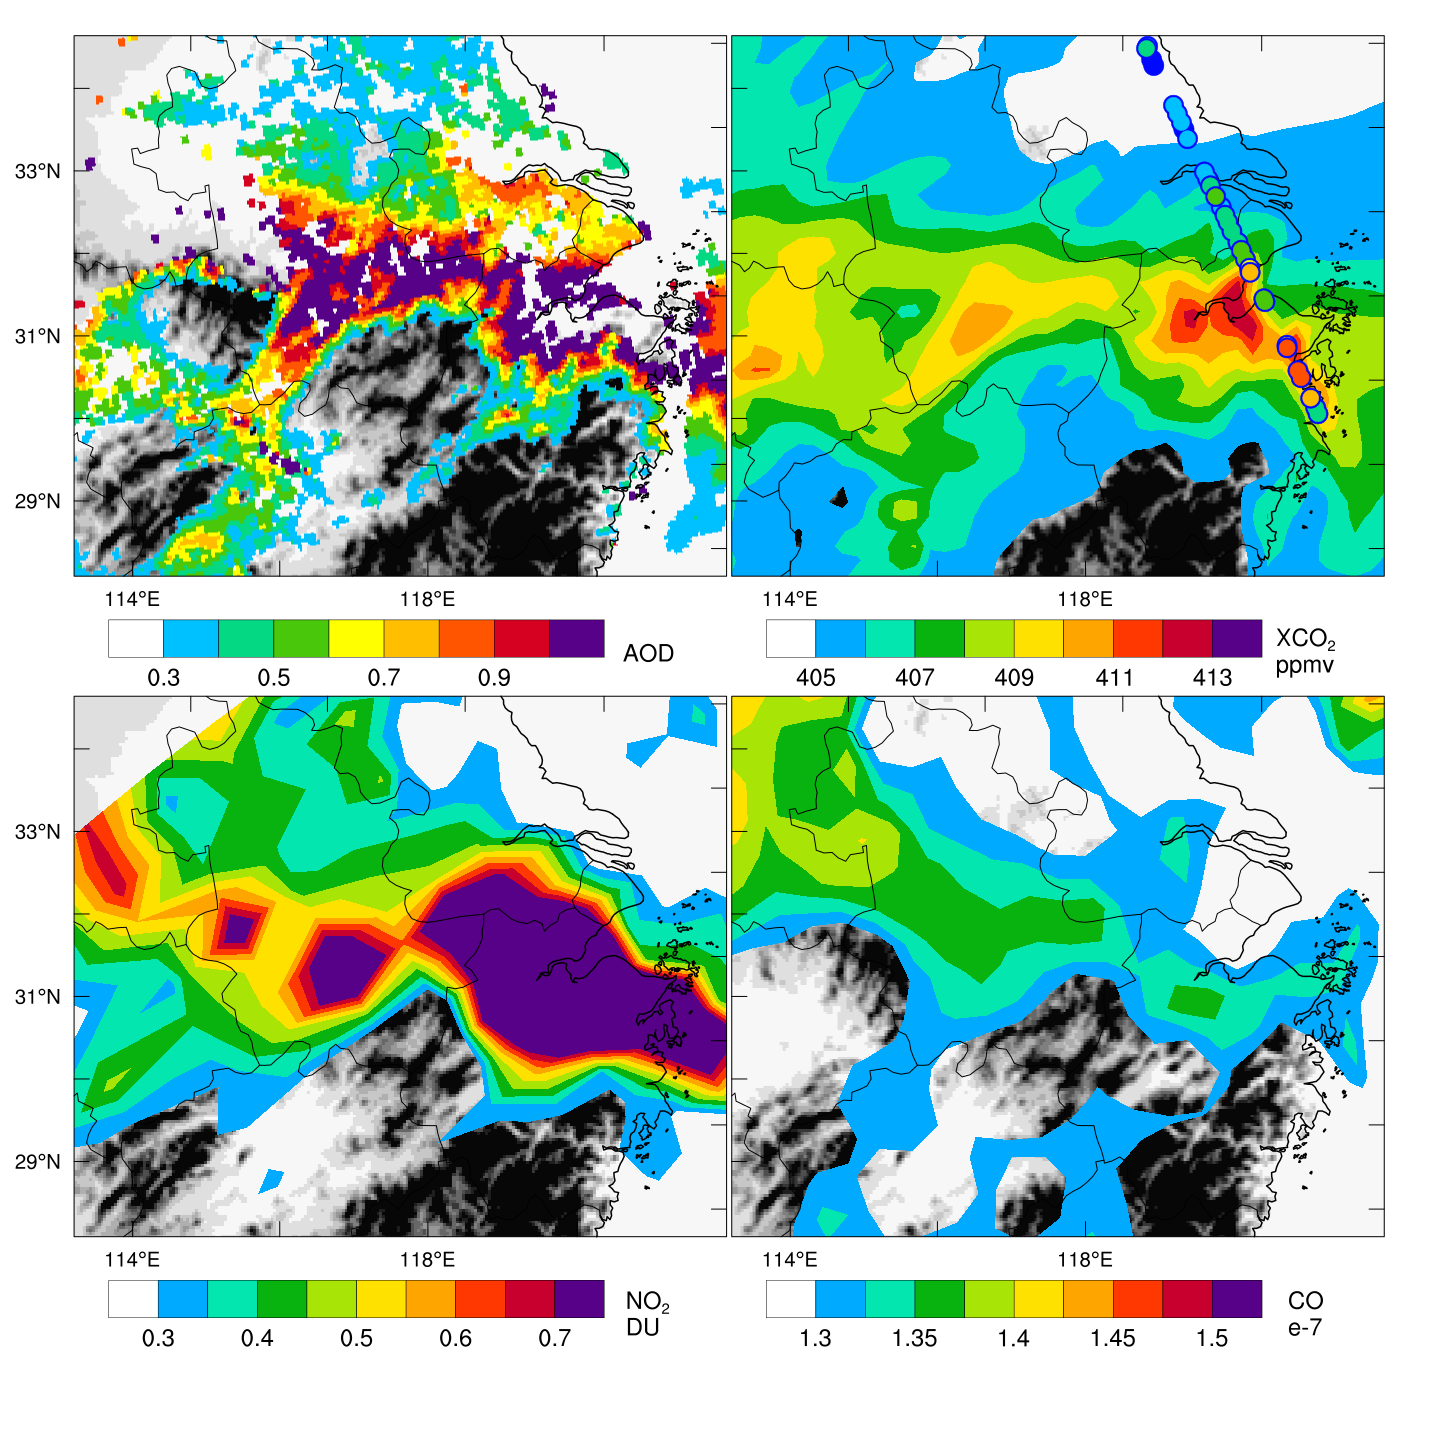
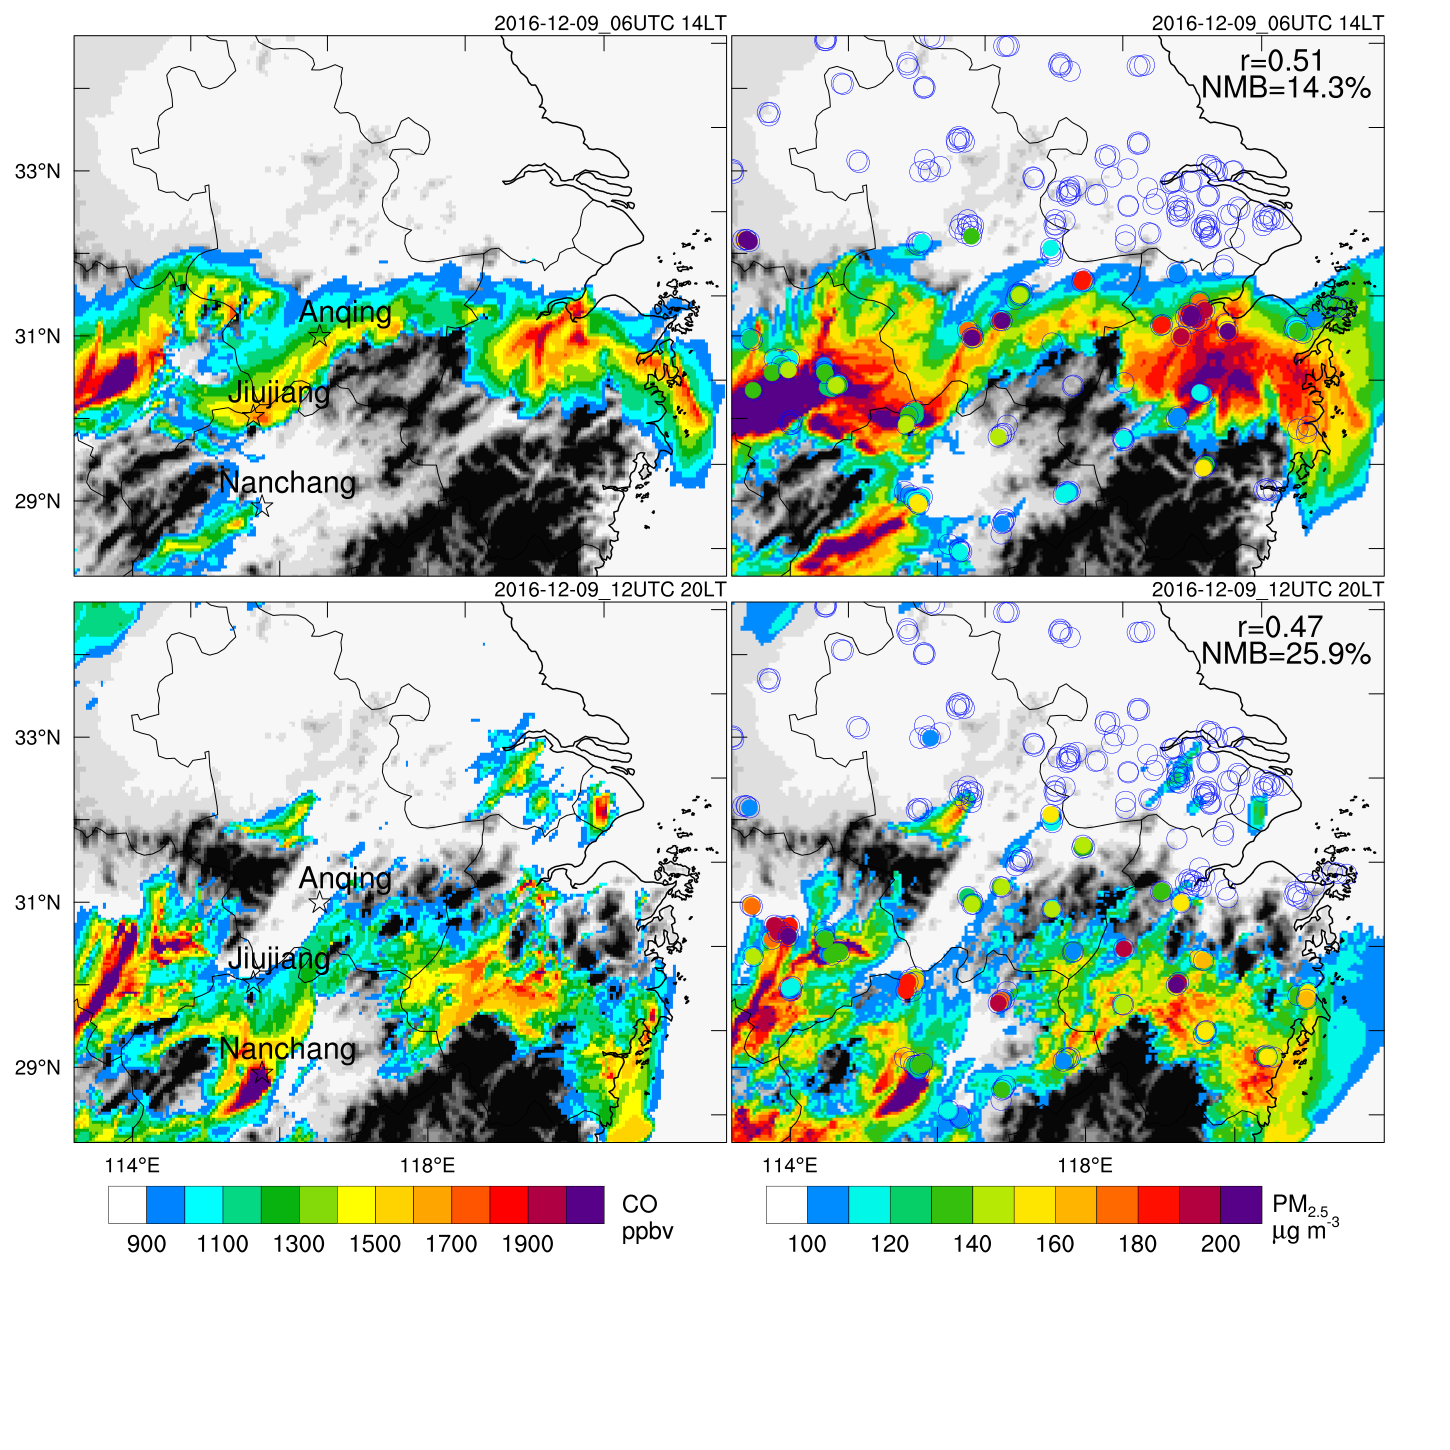
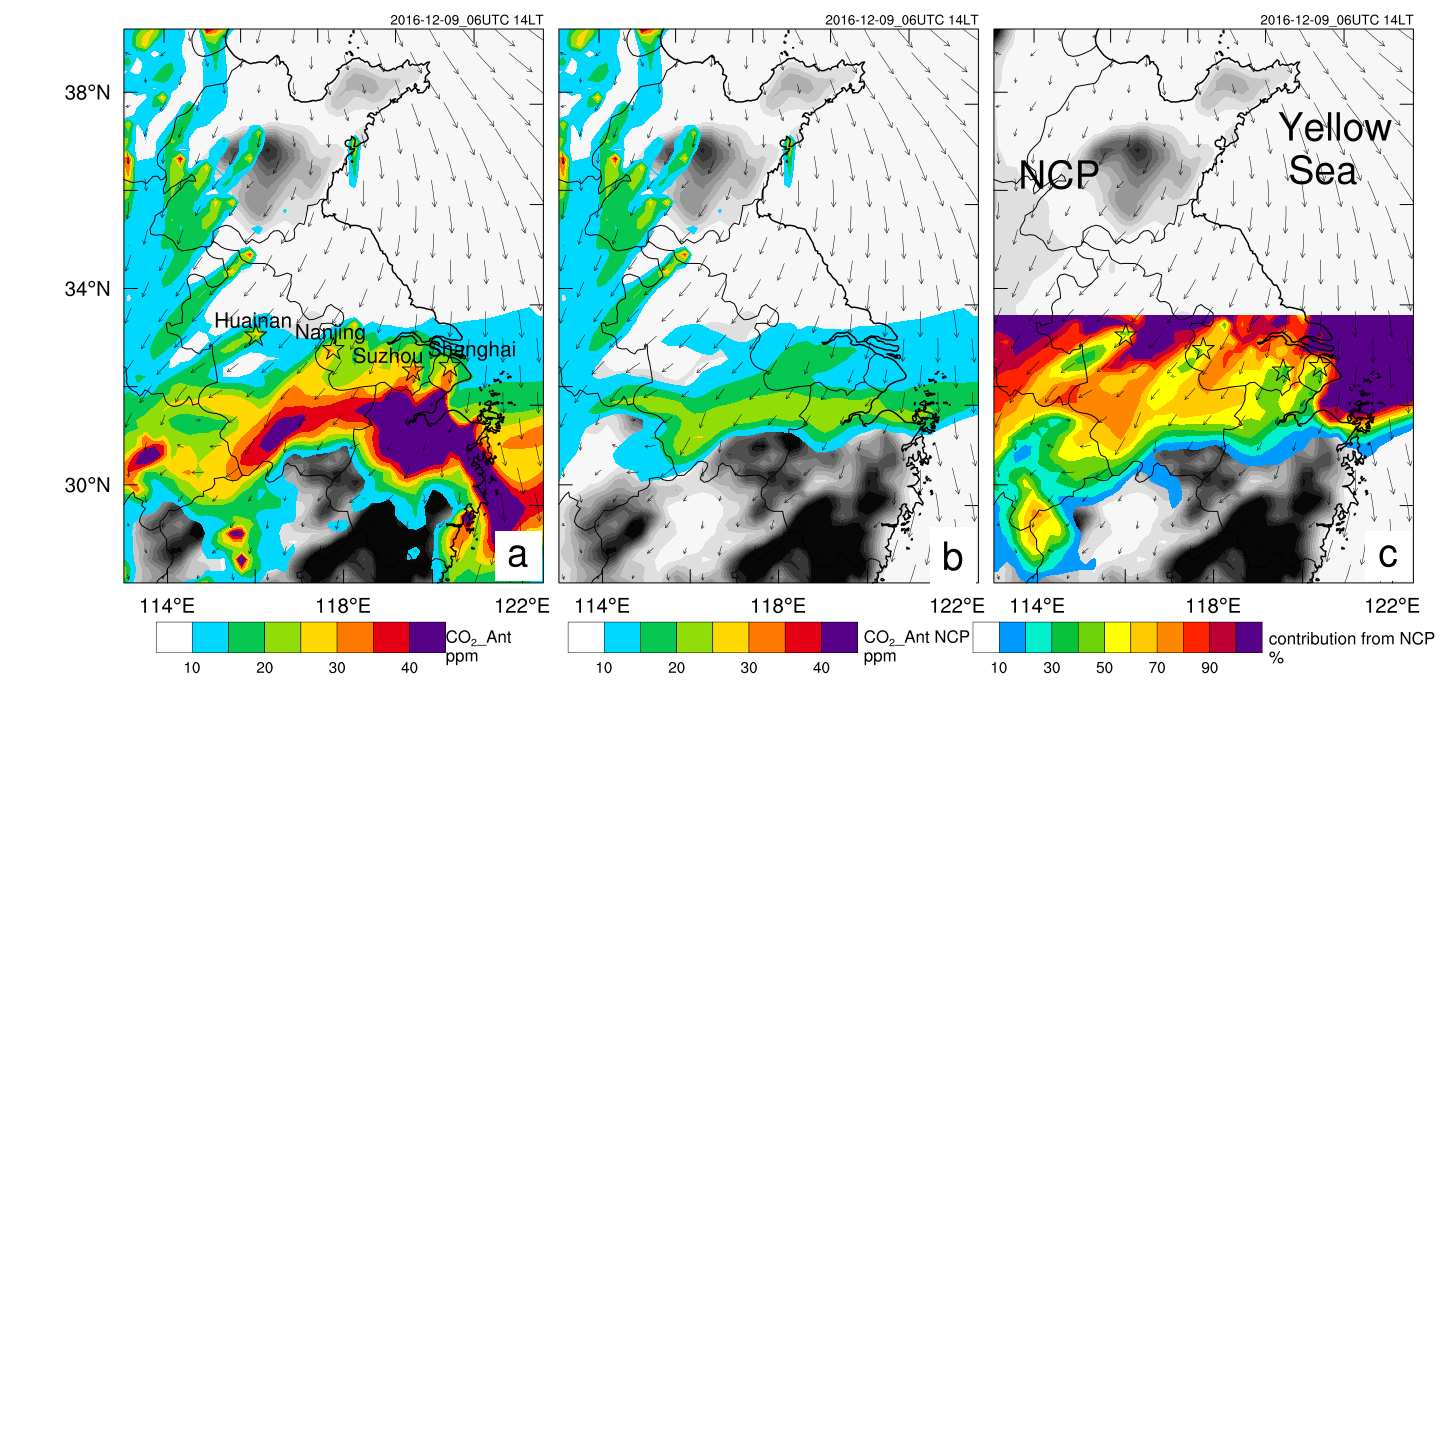
Data WRF-GHG LES; Observation_LICOR; Fig. 1, SRTM terrain height ; NCL script Fig. 2, CH4 release rate ; NCL script Fig. 3, plume overlay ; NCL script Fig. 4, TS CH4 from Wes Python script; Fig. 5, TS T2 sim vs obs add winds & PBLH; add winds; NCL; (v1) Fig. 6, Combined ; NCL script; (Sounding 12z; 23z) Fig. 7 cross-section CH4 NLCD urban; NCL script; (MODIS LU) Fig. 8 cross-section KH & T ; NCL script Fig. 9 Spatial T & w: updated urban LU; NCL script; (old patchy) Fig. 10 cross-section CH4 3 more times NLCD ; script ; (MODIS LU) Fig. 11 Spatial T & w 3 times NLCD urban; NCL script; (MODIS default LU) Fig. 12, CH4 enhancement ratio d04 d03 ; NCL script Fig. 13 cross-section KH & T for 3 SGS ; NCL script Fig. 14, CH4 enhancement ratio d04 ; NCL script Fig. 15 CH4 enhancement at Muegge Farm png; NCL Hu, X.-M.,Gourdji, S. M., Davis, K. J., Wang, Q., Zhang, Y., Xue, M., . . . Crowell, S. M. R. (2021). Implementation of improved parameterization of terrestrial flux in WRF-VPRM improves the simulation of nighttime CO2 peaks and a daytime CO2 band ahead of a cold front. Journal of Geophysical Research: Atmospheres, e2020JD034362. 10.1029/2020JD034362. Fig. 1, Domain config Fig. 2, TS of CO2 flux at Ne3 Stats Fig. 3, TS CO2 6 towers Fig. 4, TS CO2 6 towers mean diurnal Fig. 5, TS CO2 6 towers July Fig. 6, profile LEF Fig. 7, profile WBI Fig. 8, profile BAO Fig. 9, soundings Fig. 10, CO2 overlay Fig. 11, CO2 crosssection d02 Fig. 12, CO2 component d02 along B200 Flight Fig. 13, CO2 component spatial Fig. 14, CO2 crosssection d02 nighttime Fig. 15, control-Sen1 Fig. 16, Control-Sen1 11-12CST Fig. 17, CO2 component d02 along B200 S1S2 Fig. 18, Control-Sen2 Hu, X.-M., S. Crowell, Q. Wang, Y. Zhang, K. J. Davis, M. Xue, X. Xiao, B. Moore, X. Wu, Y. Choi, and J. P. DiGangi (2020), Dynamical Downscaling of CO2 in 2016 over the contiguous United States using WRF-VPRM, a weather-biosphere-online-coupled model, J. Adv. Modeling Earth Systems, 10.1029/2019MS001875. Fig assemble Fig. 1, VPRM inputs: CT2017_ODIAC; EDGAR Fig. 2 T2 evaluation part 1 part 2 Fig. 4. Td evaluation part 1 part 2 Fig. 6 precip evaluation Part 1 ; Hilton3ReShrubRES run Part 2 Fig. 8 bio flux CT vs. WRF-VPRM part 1; CT2017; CT-NRT.v2017 part 2 Fig. 10 TS bio flux CT vs. WRF-VPRM Fig. 11 SIF Fig. 12 TS@TCCON ODIAC_CT2017; Hilton3ReShrubRES Fig. 13 VS NOAA flights at2sites Fig. 14 OverlayMonthly & contribution CT2017_ODIAC run; old Fig. 15 XCO2 overlay cases CT2017_ODIAC run; old run Fig. 16 NOAA weather analysis Fig. 17 from Qingyu Fig. 18 TS contribution CT2017_ODIAC run; old run Fig. 19 case 7/25 Fig. 20 case 7/25 B200 Fig. 21 case 8/5: with theta ; old Fig. 22 profile 8/5: C130+RRS only C130 Fig. 23 8/5 B200 Fig. 24 profile 8/5 B200 Fig. 25 case 8/21 Fig. 26 case 8/21 B200 Fig. 27 profile 8/21 B200: B200+RRS; only B200 ______old__________ Fig. 25 profile 8/21 CT2017_ODIAC run ; Hilton3ReShrubRES run Hu, X.-M., et al. (2021). Multi-sensor and Multi-model Monitoring and Investigation of a Wintertime Air Pollution Event Ahead of a Cold Front over Eastern China. J. Geophys. Res.-Atmospheres, 10.1029/2020JD033538. MultiModelMultiSensor2016Dec9 Fig ; tet Fig1 DomainConfig+CO2emission ; NCL Fig2, MICAPS weather map from Danhua Fig3 emission NO vs. CO2; scattering Fig4 TS_PM with PM LinAn (Python) (CO2; without PM LinAn) Fig5 south penetration Fig6 T2 overlay PBLH Fig7 Profile two_models; old_one_model Fig8 WSP NO XCO2 Fig9 4 satellite spatial 500mb AIRS CO; NCL; near-surface CO Fig10 spatial CO & PM2.5 Fig11, scattering between simulated XCO2 vs. MODIS AOD Fig12 contribution of NCP Fig13 4 XCO2 cases |